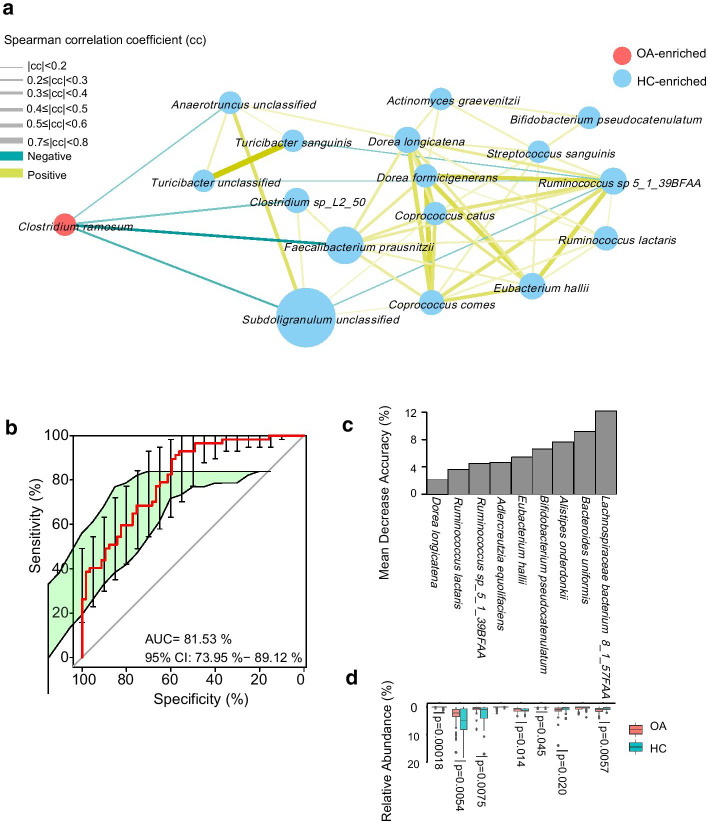
Fig. 2.
Deferentially enriched species between the OA patients and their controls. For selected different species, the orientation of enrichment was determined by partial correlation test (p < 0.05, Additional file 1: Table S4). Size of the nodes consistent with the relative abundance of species. Species were colored according to enrichment. Edges between nodes indicated positive (ginger) and negative (blue) Spearman’s correlation. The line thickness represents the correlation coefficient which calculated according to the samples under comparison (a). Receiver operating characteristic curve (ROC) according to 114 samples of the discovery set from 57 OA patients and 57 HCs (green line) calculated by Cross-validated random forest models. Area under ROC (AUC) and the 95% confidence interval are also shown (b). The height of the column indicates the contribution of the species to the discriminative model (c). The relative abundance and significance of 9 species in OA classifier (d)

