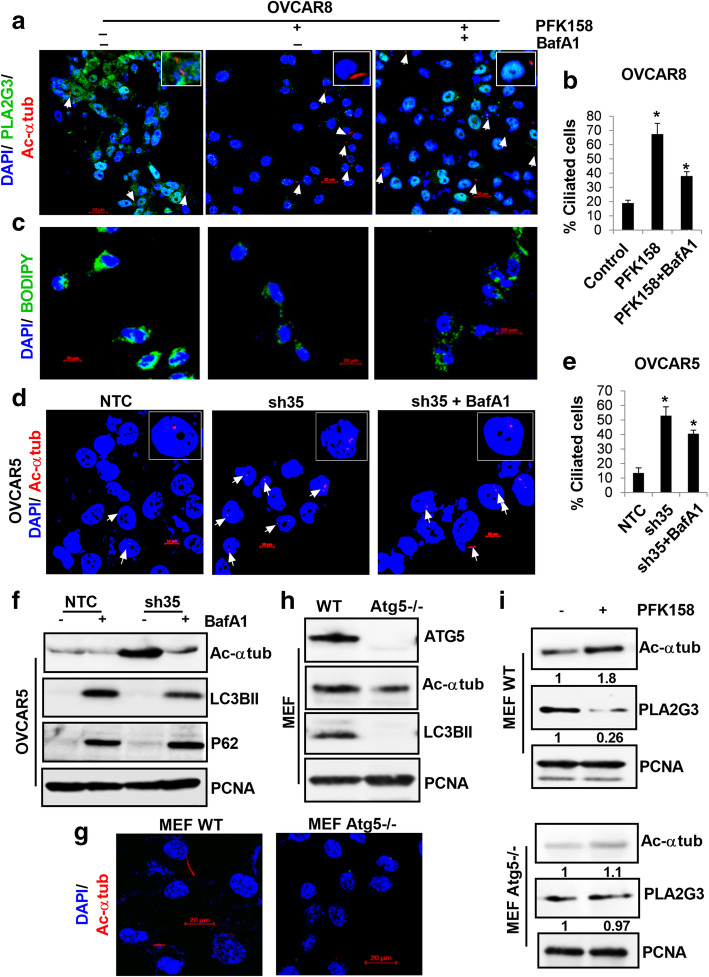
Fig. 6.
Autophagy plays a critical role in the regulation of PLA2G3 and primary ciliation. (A) Representative confocal images by IF analysis of fluorescently tagged-acetylated α tubulin (red) and PLA2G3 expression (green) upon 10µM PFK158 treatment with or without BafA1 (50nM) pretreatment in OVCAR8 cells. DAPI was used to stain nuclei. Scale bar: 20 μm. (B) Percent ciliated cells was quantified in 100 cells per field and represented as mean ± SD (*p < 0.05 vs. control). (C) Under similar conditions, Bodipy staining of LDs were visualized in OVCAR8 cells. DAPI was used to stain nuclei. Scale bar:20 μm. (D-E) IF study was performed in OVCAR5 NTC and sh35 KD cells in with or without 50nM BafA1 pretreatment (2 h) against fluorescently tagged-acetylated α tubulin (red). DAPI was used to stain nuclei. Scale bar: 10 μm. Percent ciliated cells were scored in 100 cells per field and represented (*p < 0.05 vs. control). (F) Immunoblot analysis of acetylated α tubulin, LC3BII and p62/SQSTM1 under similar condition was performed. PCNA was probed for endogenous control. (G) IF study of acetylated α tubulin levels was assessed in wild-type (WT) and Atg5 knockout MEF cells. Scale bar:20 μm. (H) Western analysis for acetylated α tubulin and LC3BII was done in the mentioned cells. The ATG5 expression level was validated. (I) PLA2G3 and acetylated α tubulin expression was assessed in WT and Atg5-/- MEF cells upon 5µM PFK158 treatment. PCNA was used as a loading control. Fold change was calculated using Image J software, normalized to control and provided beneath the panel

