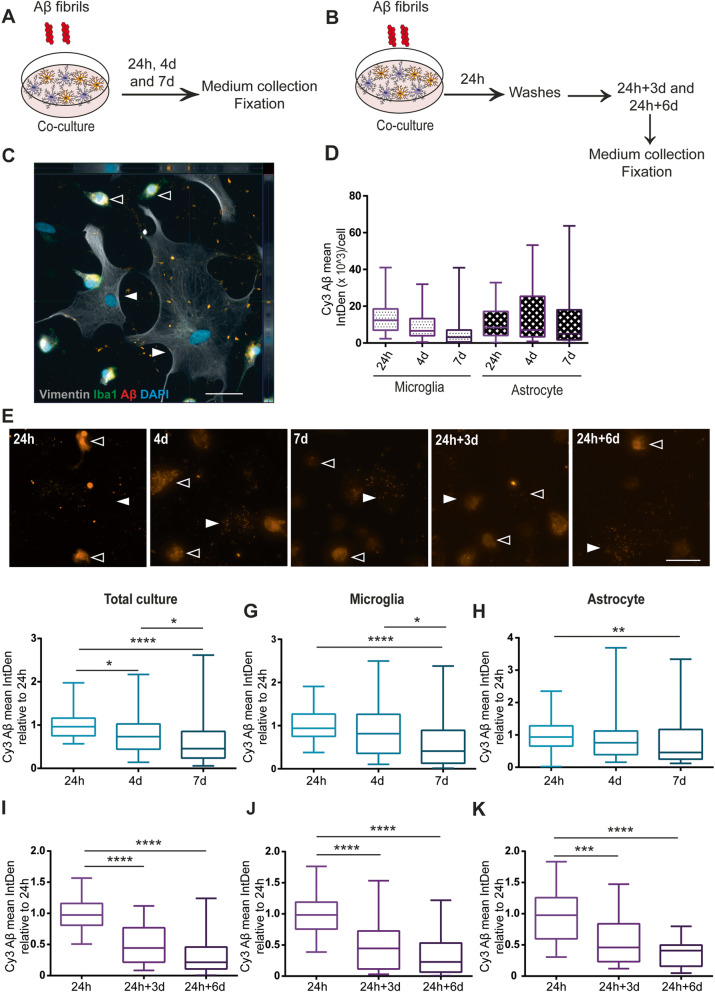
Fig. 4.
Intracellular Aβ is reduced when astrocytes and microglia are cultured together. Schematic figure of the study design illustrating that the cells were either treated with Aβ-F constantly (a) or with a 24h Aβ-F pulse (b). In the co-culture, both astrocytes (Iba1- S100B+, filled arrow heads) and microglia (Iba1+, open arrow heads) ingested and accumulated Aβ-F (c). Image analysis and normalization to the number of cells confirmed that astrocytes and microglia contained comparable levels of Aβ at 24h, 4d and 7d (d). Representative images of the Aβ deposits at the different time points in the co-culture are shown in (e); astrocytes and microglia are indicated with filled respective open arrow heads. Analysis of the total intracellular Aβ in the co-culture revealed that intracellular Aβ was lower in the culture at 7d, compared to 24h (f). Separate analysis of the two cell types in the co-culture demonstrated that the astrocytes, rather than the microglia, were responsible for this reduction (g, h). When the co-cultures were washed at 24h and cultured without Aβ-F for 3d and 6d, a significant reduction was observed over time (i), which was due to a decrease in both microglia (j) and astrocytes (k). Scale bars = 20μm

