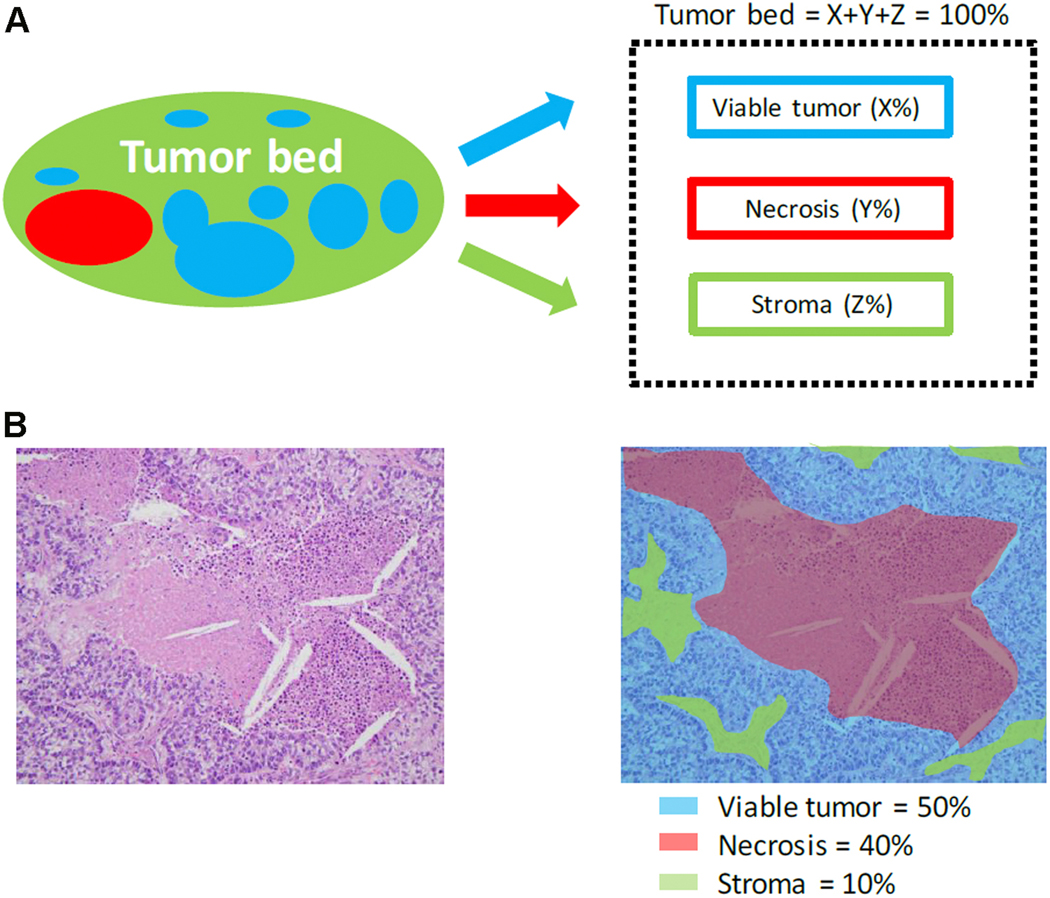
Figure 8:
Histologic components of the tumor bed. A) Schematic image showing how percentage compositions are assigned. The tumor bed is divided into viable tumor area, necrosis and stroma. Stroma includes inflammation and fibrosis. B) A representative hematoxylin-and-eosin stained slide image (left) and a corresponding color illustration of the distribution of the components (right). The blue, red and black areas represent viable tumor, necrosis and stroma, respectively. Figure 1 from Qu et al. with permission.53

