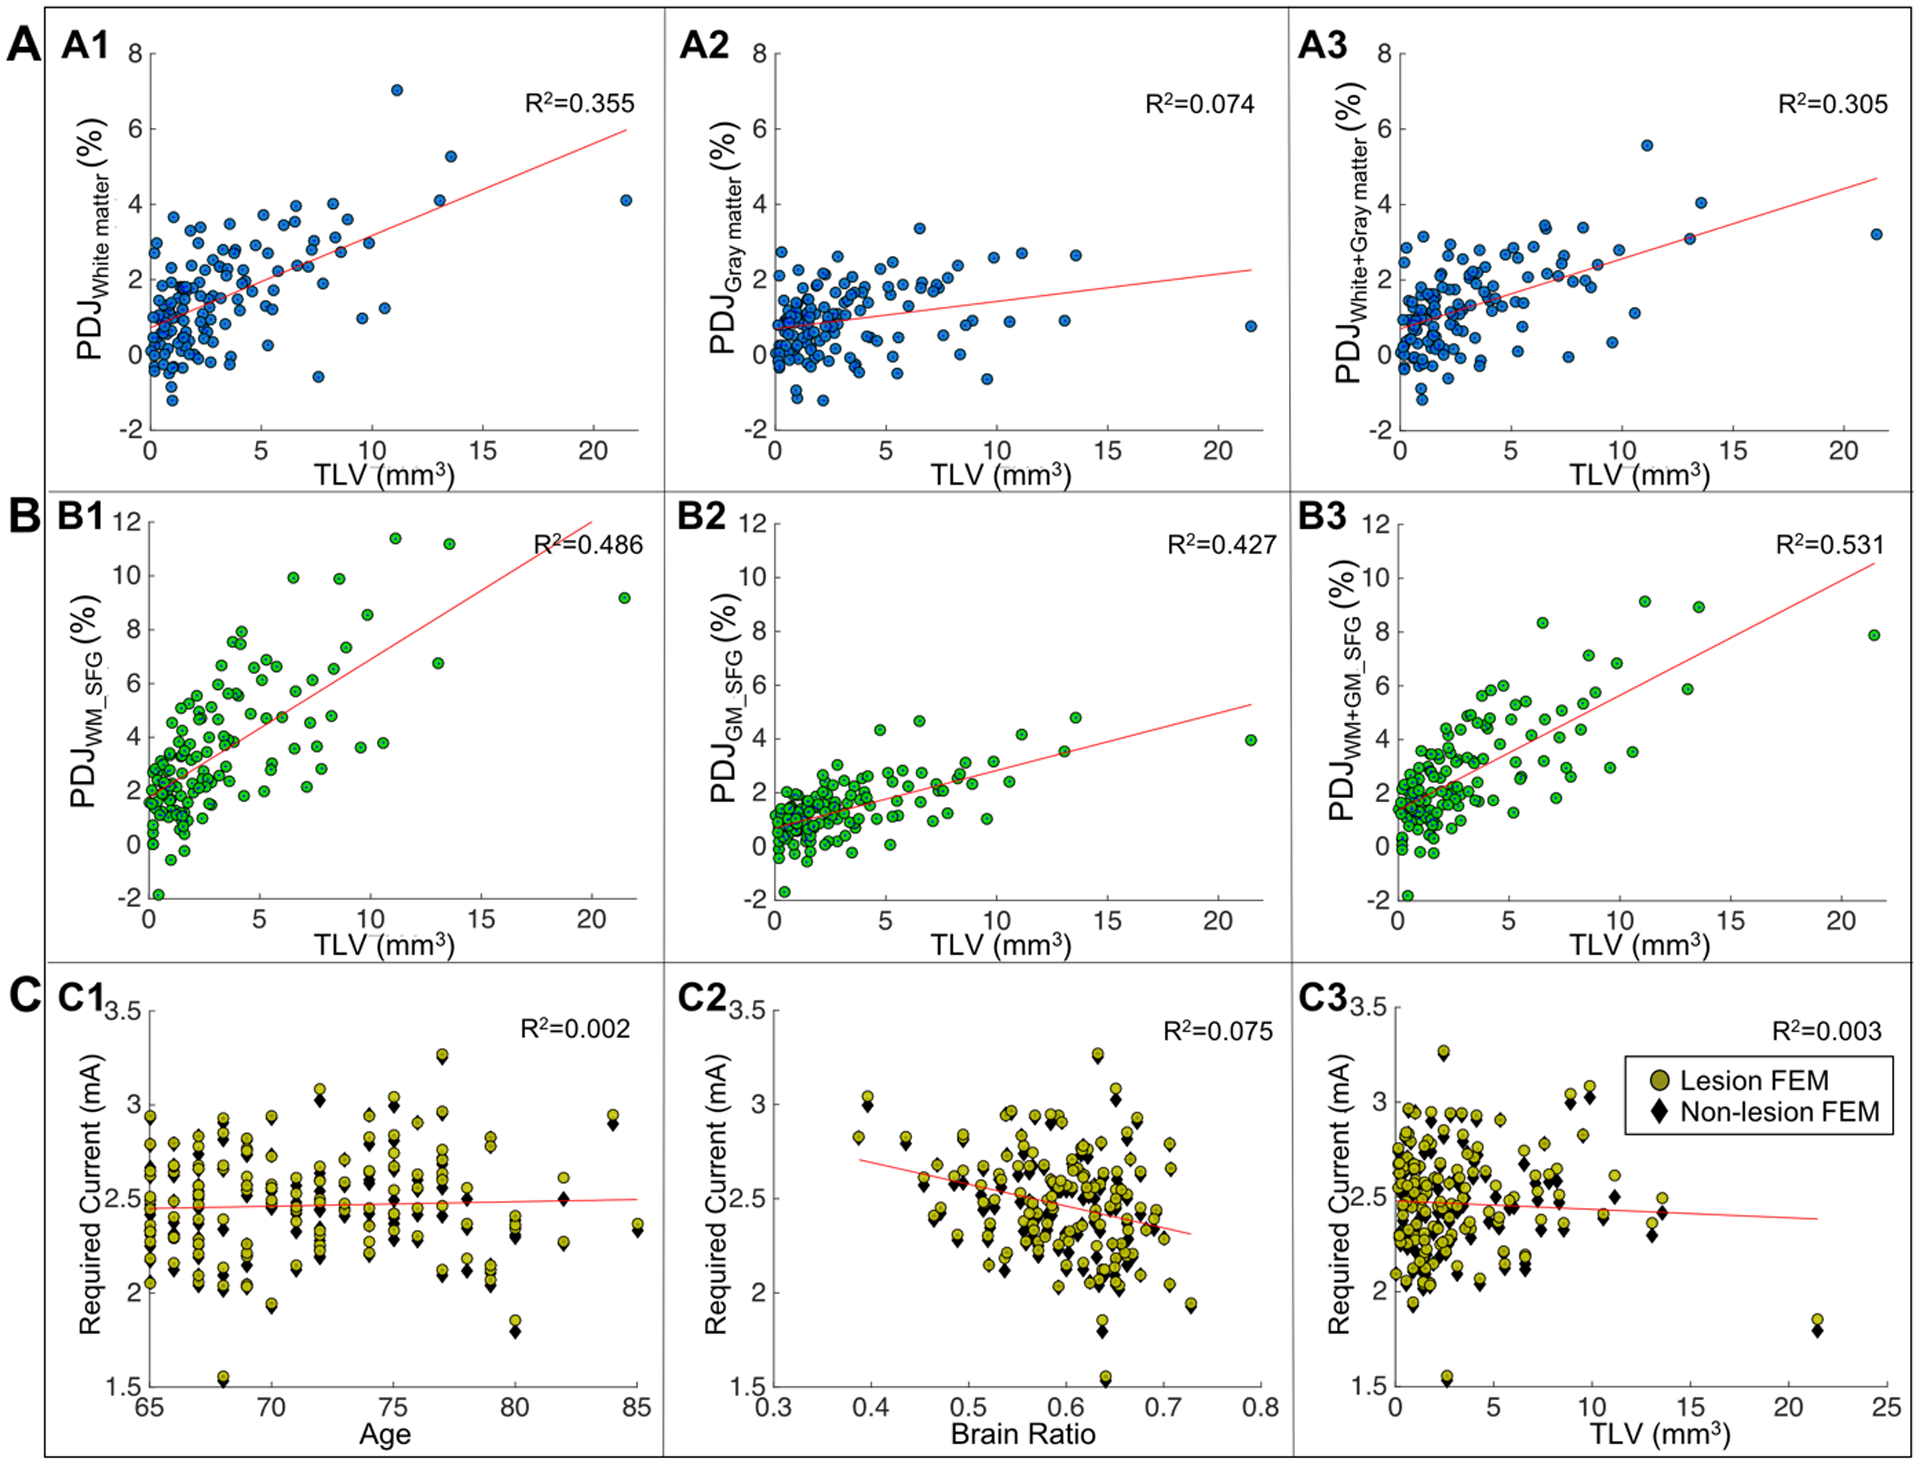
Figure 2.

Scatter plots of current density distribution in the brain. A) Correlation plots between total lesion volume (TLV) and percentage differences in current density (PDJ) in white matter (A1), gray matter (A2) and white+gray matter (A3). B) Correlation plots between total lesion volume (TLV) and percentage differences in current density (PDJ) within the superior frontal gyrus (SFG) for white matter SFG (B1), gray matter SFG (B2) and white+gray matter SFG (B3). C) Required current dose to be adjusted in the aging brain relative to a 2mA stimulation in young adult brains for lesion FEM (yellow circles) and non-lesion FEM (black diamonds) for dose vs. age (C1), dose vs. brain ratio (C2), and dose vs. TLV (C3).
