
Figure 7.
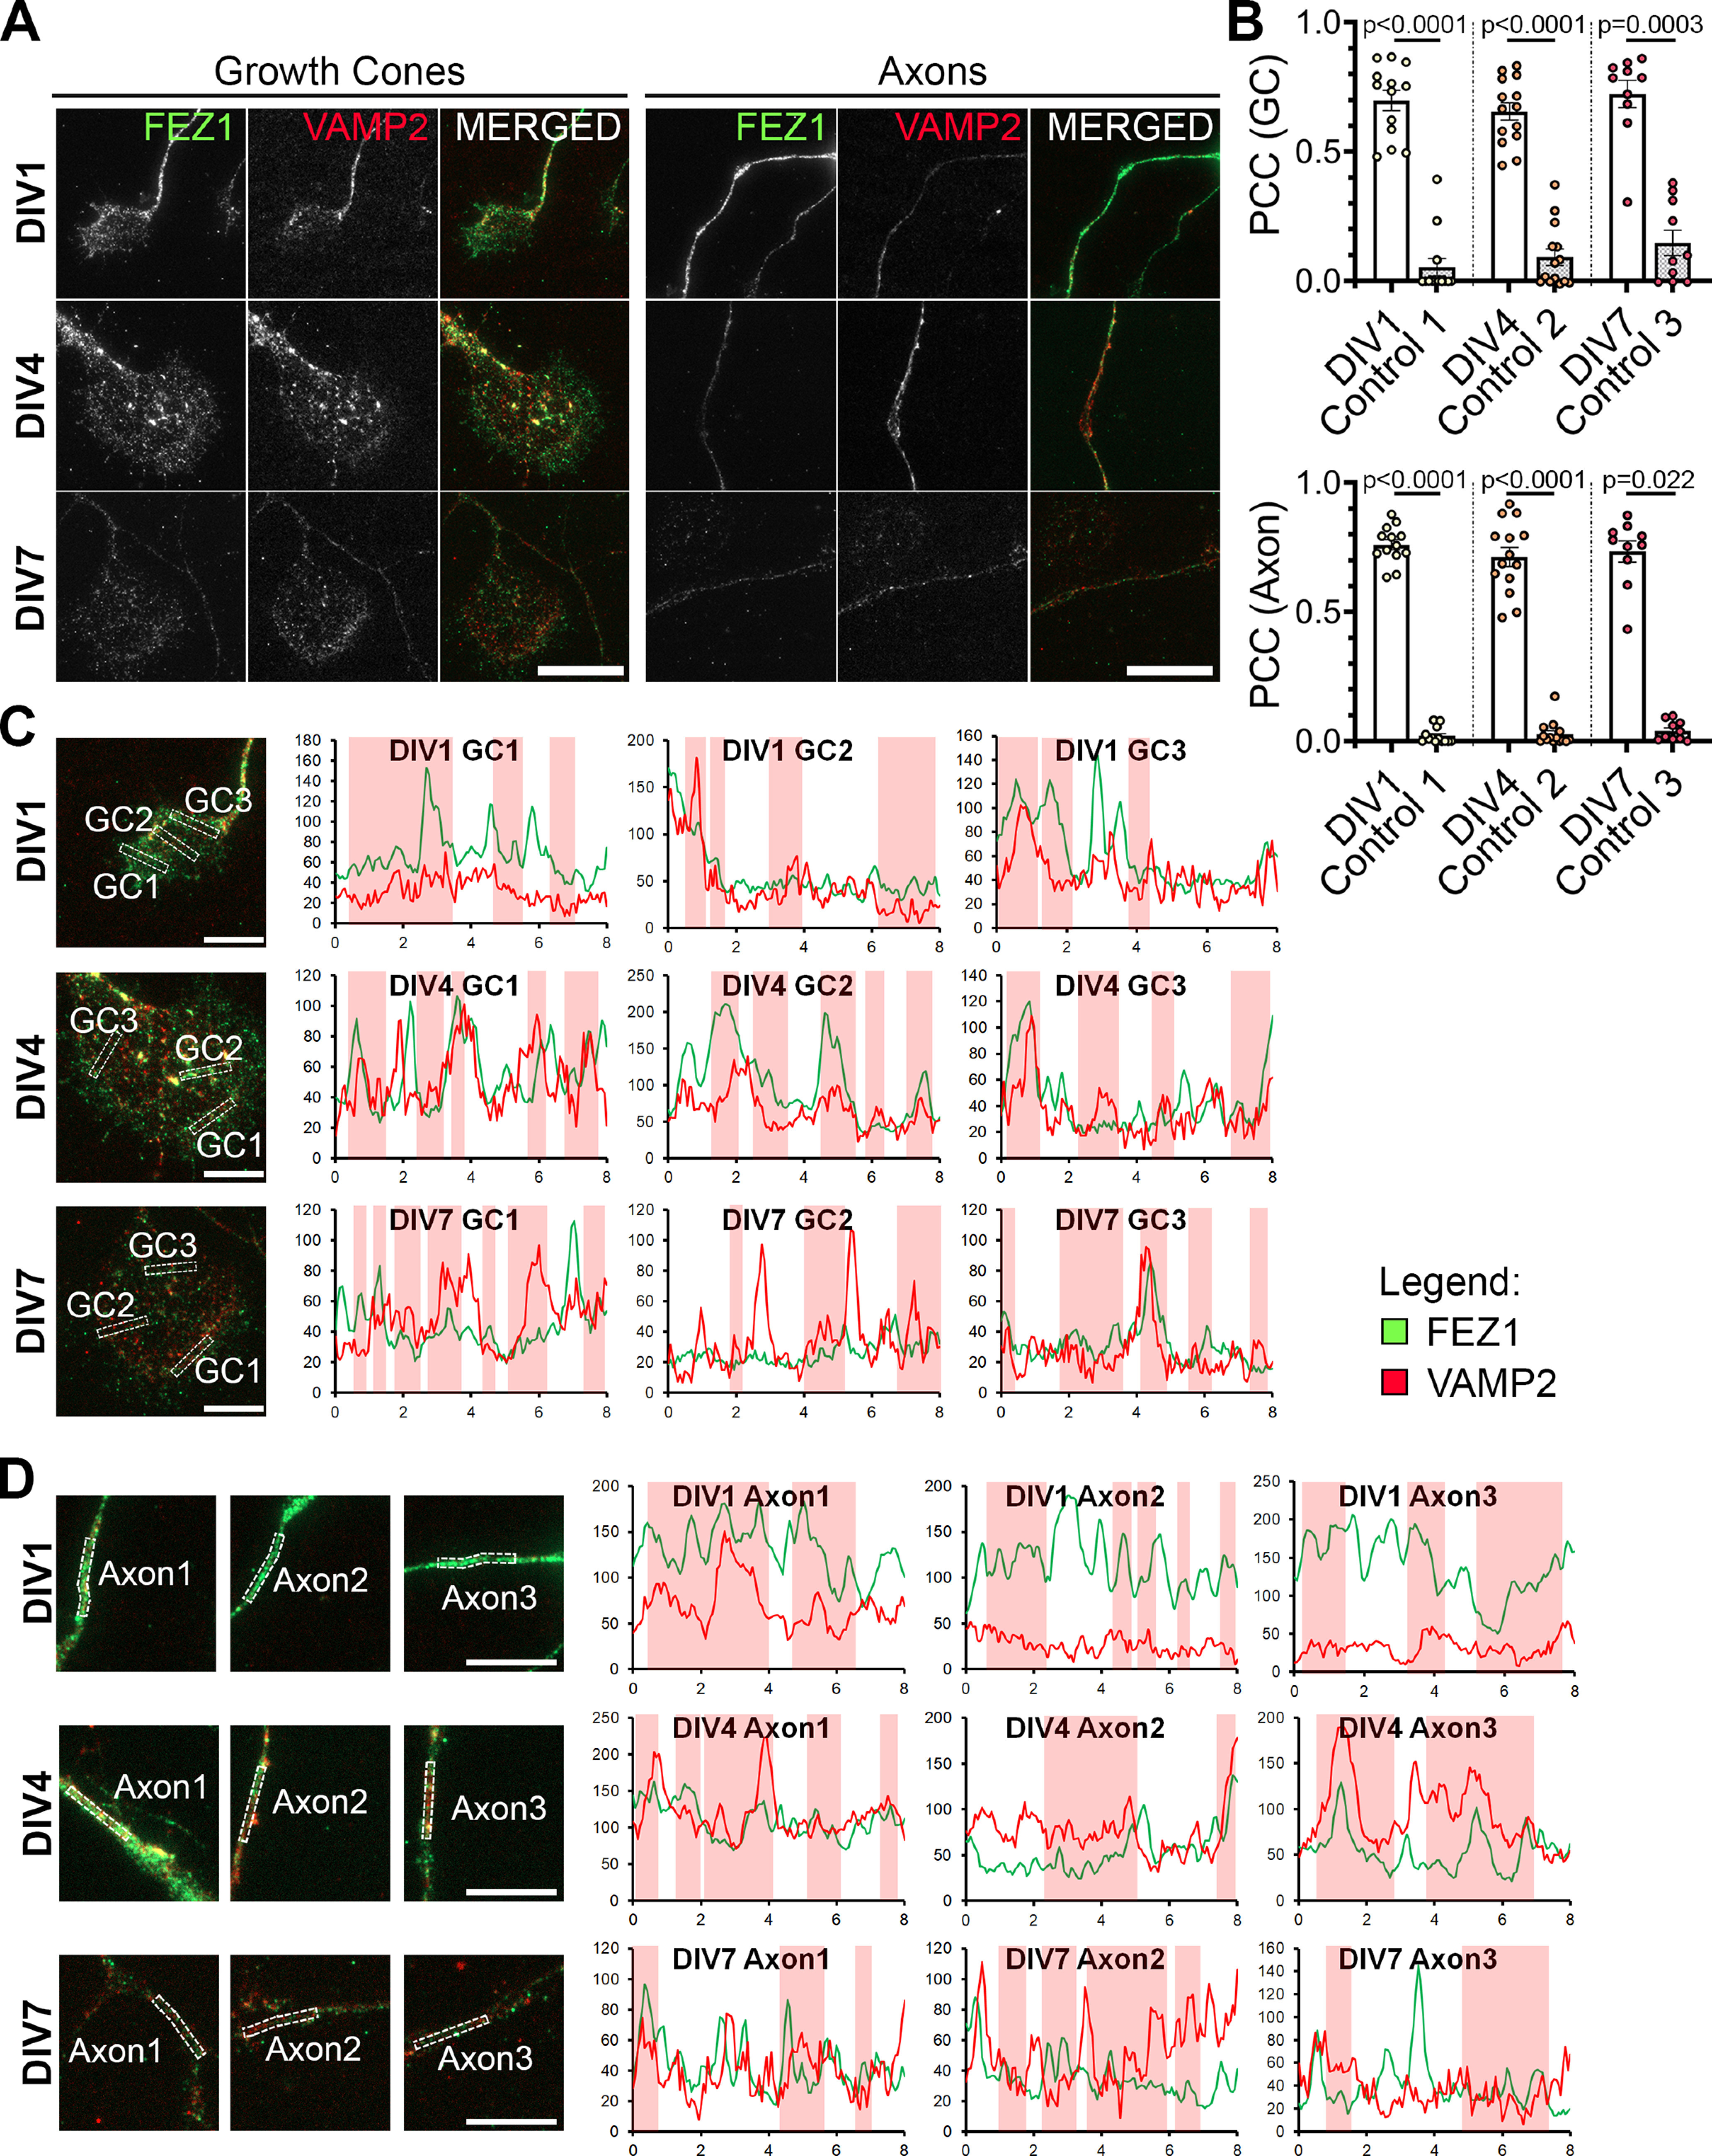
FEZ1 and VAMP2 co-localize in growth cones and axons. A, Immunostaining of FEZ1 and VAMP2 in growth cones and axons of hippocampal neurons at 1, 4, and 7 DIV. Punctate staining of FEZ1 and VAMP2 are observed. Scale bars: 20 μm. B, PCC analysis of fluorescence intensities of both proteins in growth cones. Control values were obtained by measuring the PCC with the rotated image of one channel. DIV1 n = 13, DIV4 n = 14, DIV7 n = 10, collected over three independent experiments. Statistical significance (experimental vs control) was determined using Kruskal–Wallis analysis. All error bars represent SEM. C, D, Line scan analysis for co-localization between FEZ1 and VAMP2 in growth cones and axons. Merged images are shown. x- and y-axes, distance (μm) and gray values, respectively; axon 1, distal; axon 2, intermediate; axon 3, proximal (relative to cell body). Vertical columns in red represent regions of colocalization. Scale bars: 10 μm. Additional line scans are shown in Extended Data Figure 7-1.