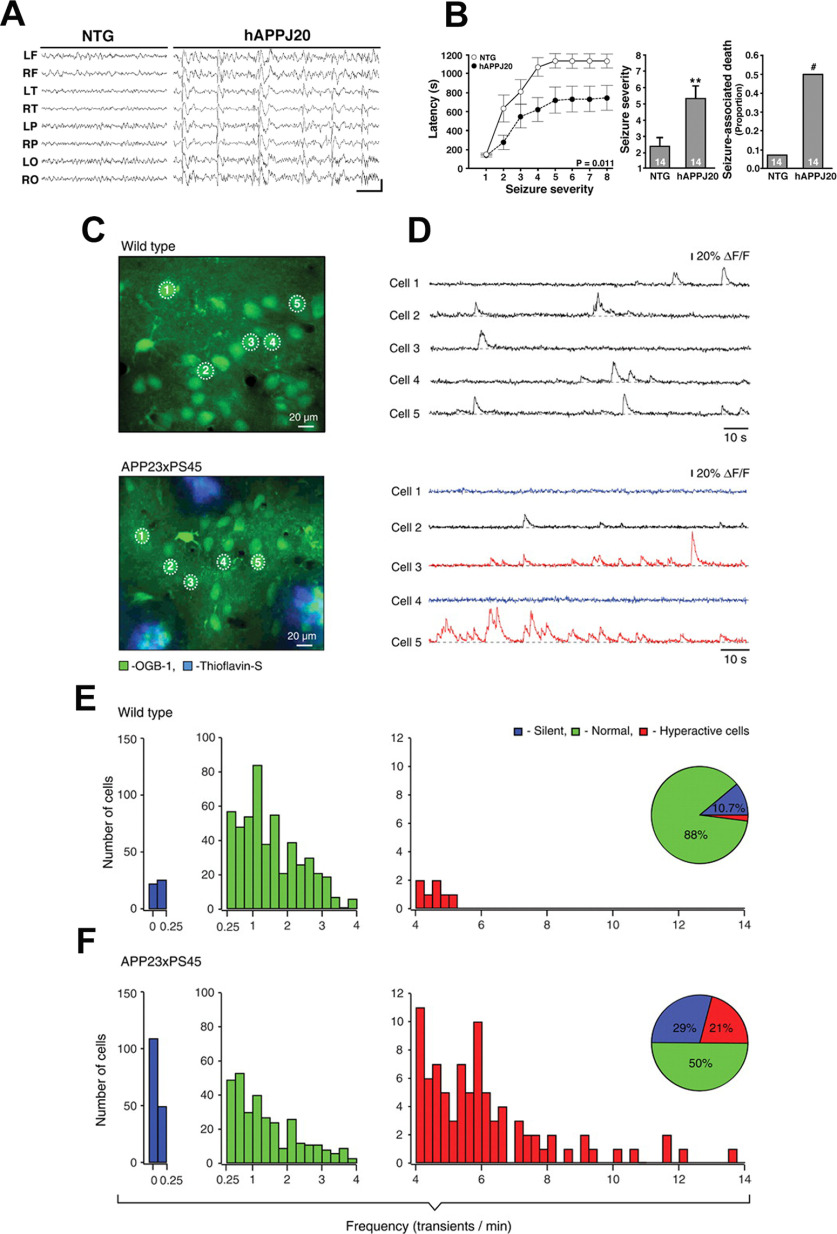
Figure 1.
Neuronal network hyperexcitability at advanced stages of pathology in hAPP/Aβ mouse models of AD. A, B, Aberrant synchronous neuronal network activity, spontaneous nonconvulsive seizures, and increased susceptibility to PTZ-induced seizures in four- to seven-month-old hAPP-J20 mice. Reproduced from Palop et al. (2007) with permission from Elsevier. A, Chronic cortical EEG recordings performed in freely moving, untreated hAPP-J20 mice, and non-transgenic (NTG) controls. L, left; R, right; F, frontal; T, temporal; P, parietal; O, posterior-parietal, indicate the position of recording electrodes. In contrast to NTG mice, which showed normal EEG activity (left), hAPP-J20 mice exhibited frequent (5–50/min) generalized cortical epileptiform (interictal) spike discharges (right). Calibration: 1 s and 400 mV. B, Mice were injected intraperitoneally with PTZ (GABAA antagonist), behavior was videorecorded, and seizure severity was scored off-line. Compared with NTG controls, hAPP-J20 mice had shorter latencies to reach a given seizure severity (left), greater overall seizure severity (center), and more seizure-associated deaths (right); ∗∗p < 0.01 versus NTG by Student’s t test; #p < 0.05 by Fisher’s exact test. Quantitative data represent mean ± SEM. C–F, Clusters of hyperactive neurons near amyloid plaques in APP23xPS45 mice. In vivo two-photon calcium imaging from layer 2/3 cortical neurons. Reproduced with permission from Busche et al. (2008). C, D, Spontaneous Ca2+ transients (D) recorded in vivo in the corresponding neurons of the frontal cortex shown in C in a WT (top) and a APP23xPS45 (bottom) mouse. Traces in D, bottom, are color-coded to mark neurons that were either inactive during the recording period (blue) or showed an increased frequency of Ca2+ transients (red). E, F, Histograms showing the frequency distribution of Ca2+ transients in WT and APP23xPS45 mice (in both cases n = 564 cells). There is a substantial increase in the amount of silent and hyperactive neurons in APP23xPS45 mice. (Insets) Pie charts showing the relative proportion of silent, normal, and hyperactive neurons in WT (n = 10) and APP23xPS45 (n = 20) mice.

