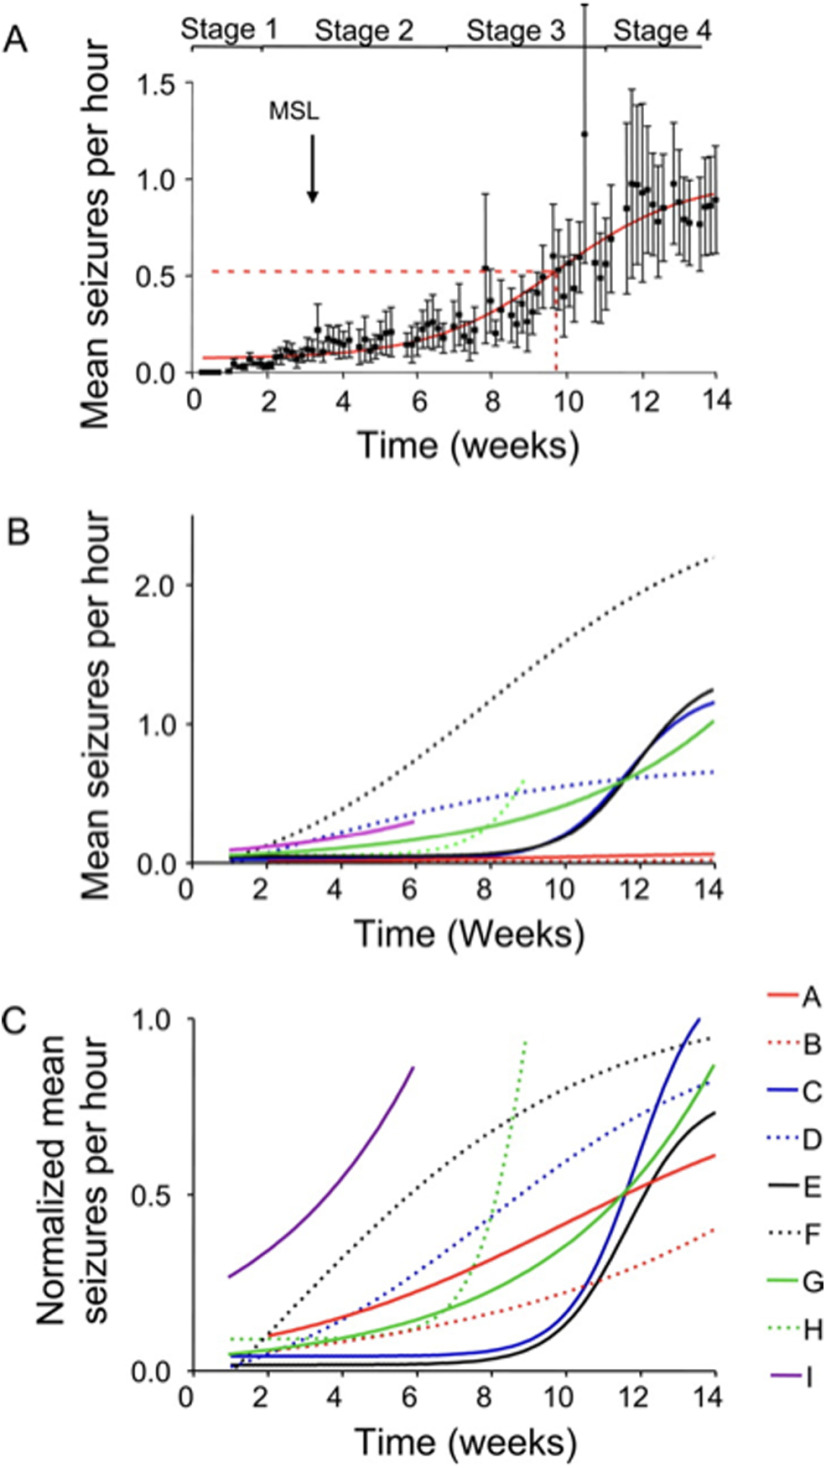
Figure 5.
Seizure progression over time. A, Increase in seizure frequency over 14 weeks post-injection. The latent period is reflected in stage 1, stage 2 represents the “slow growth phase”, stage 3 is characterised by an exponential growth until reaching the steady stage 4. B, Actual seizure frequency plotted on the graph. Data obtained from the 9 animals. C, Normalised seizure frequency, same cohort. (Williams et al., 2009).

