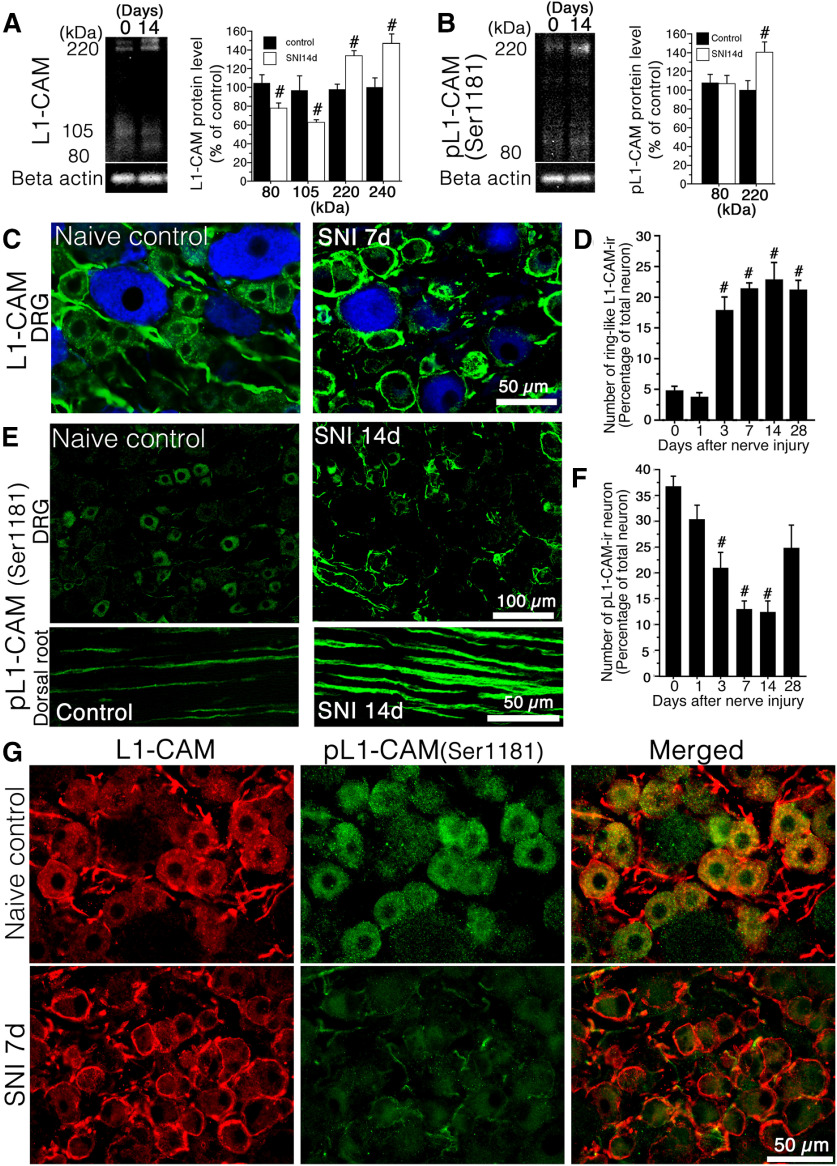
Figure 1.
Effect of peripheral nerve injury on the expression of tL1-CAM and pL1-CAM. A, B, Western blotting (WB) analysis of tL1-CAM (A) and pL1-CAM (B) protein using the total protein extracted from the L4/5 DRG taken at 0 and 14 d after surgery. Graphs show the protein levels of tL1-CAM and pL1-CAM expressed as percentages of the protein level in the normal control (mean ± SEM; each time point n = 4). C, Double fluorescence images of tL1-CAM (green) and NF-200 (blue) in the DRG of control animals (left) and 7 d after nerve injury (right). D, Quantification of ring-like tL1-CAM-ir-positive neurons in DRG following nerve injury (n = 4, each time point). E, Immunofluorescence images of pL1-CAM in the DRG (upper panel) and dorsal root (lower panel) of control animals (left) and 7 d after nerve injury (right). F, Quantification of pL1-CAM-ir-neurons in the DRG following nerve injury (n = 4, each time point). G, Double-labeled images of tL1-CAM (red) and pL1-CAM (green) in the L5 DRG of control naive (upper panels) and SNI models (lower panels). Scale bars: 50 μm (C), 100 μm (E, upper panels), 50 μm (E, lower panels), and 50 μm (G). A, B, #p < 0.05 (Student’s t test) compared with naive control (day 0). D, F, #p < 0.05 versus control (ANOVA).

