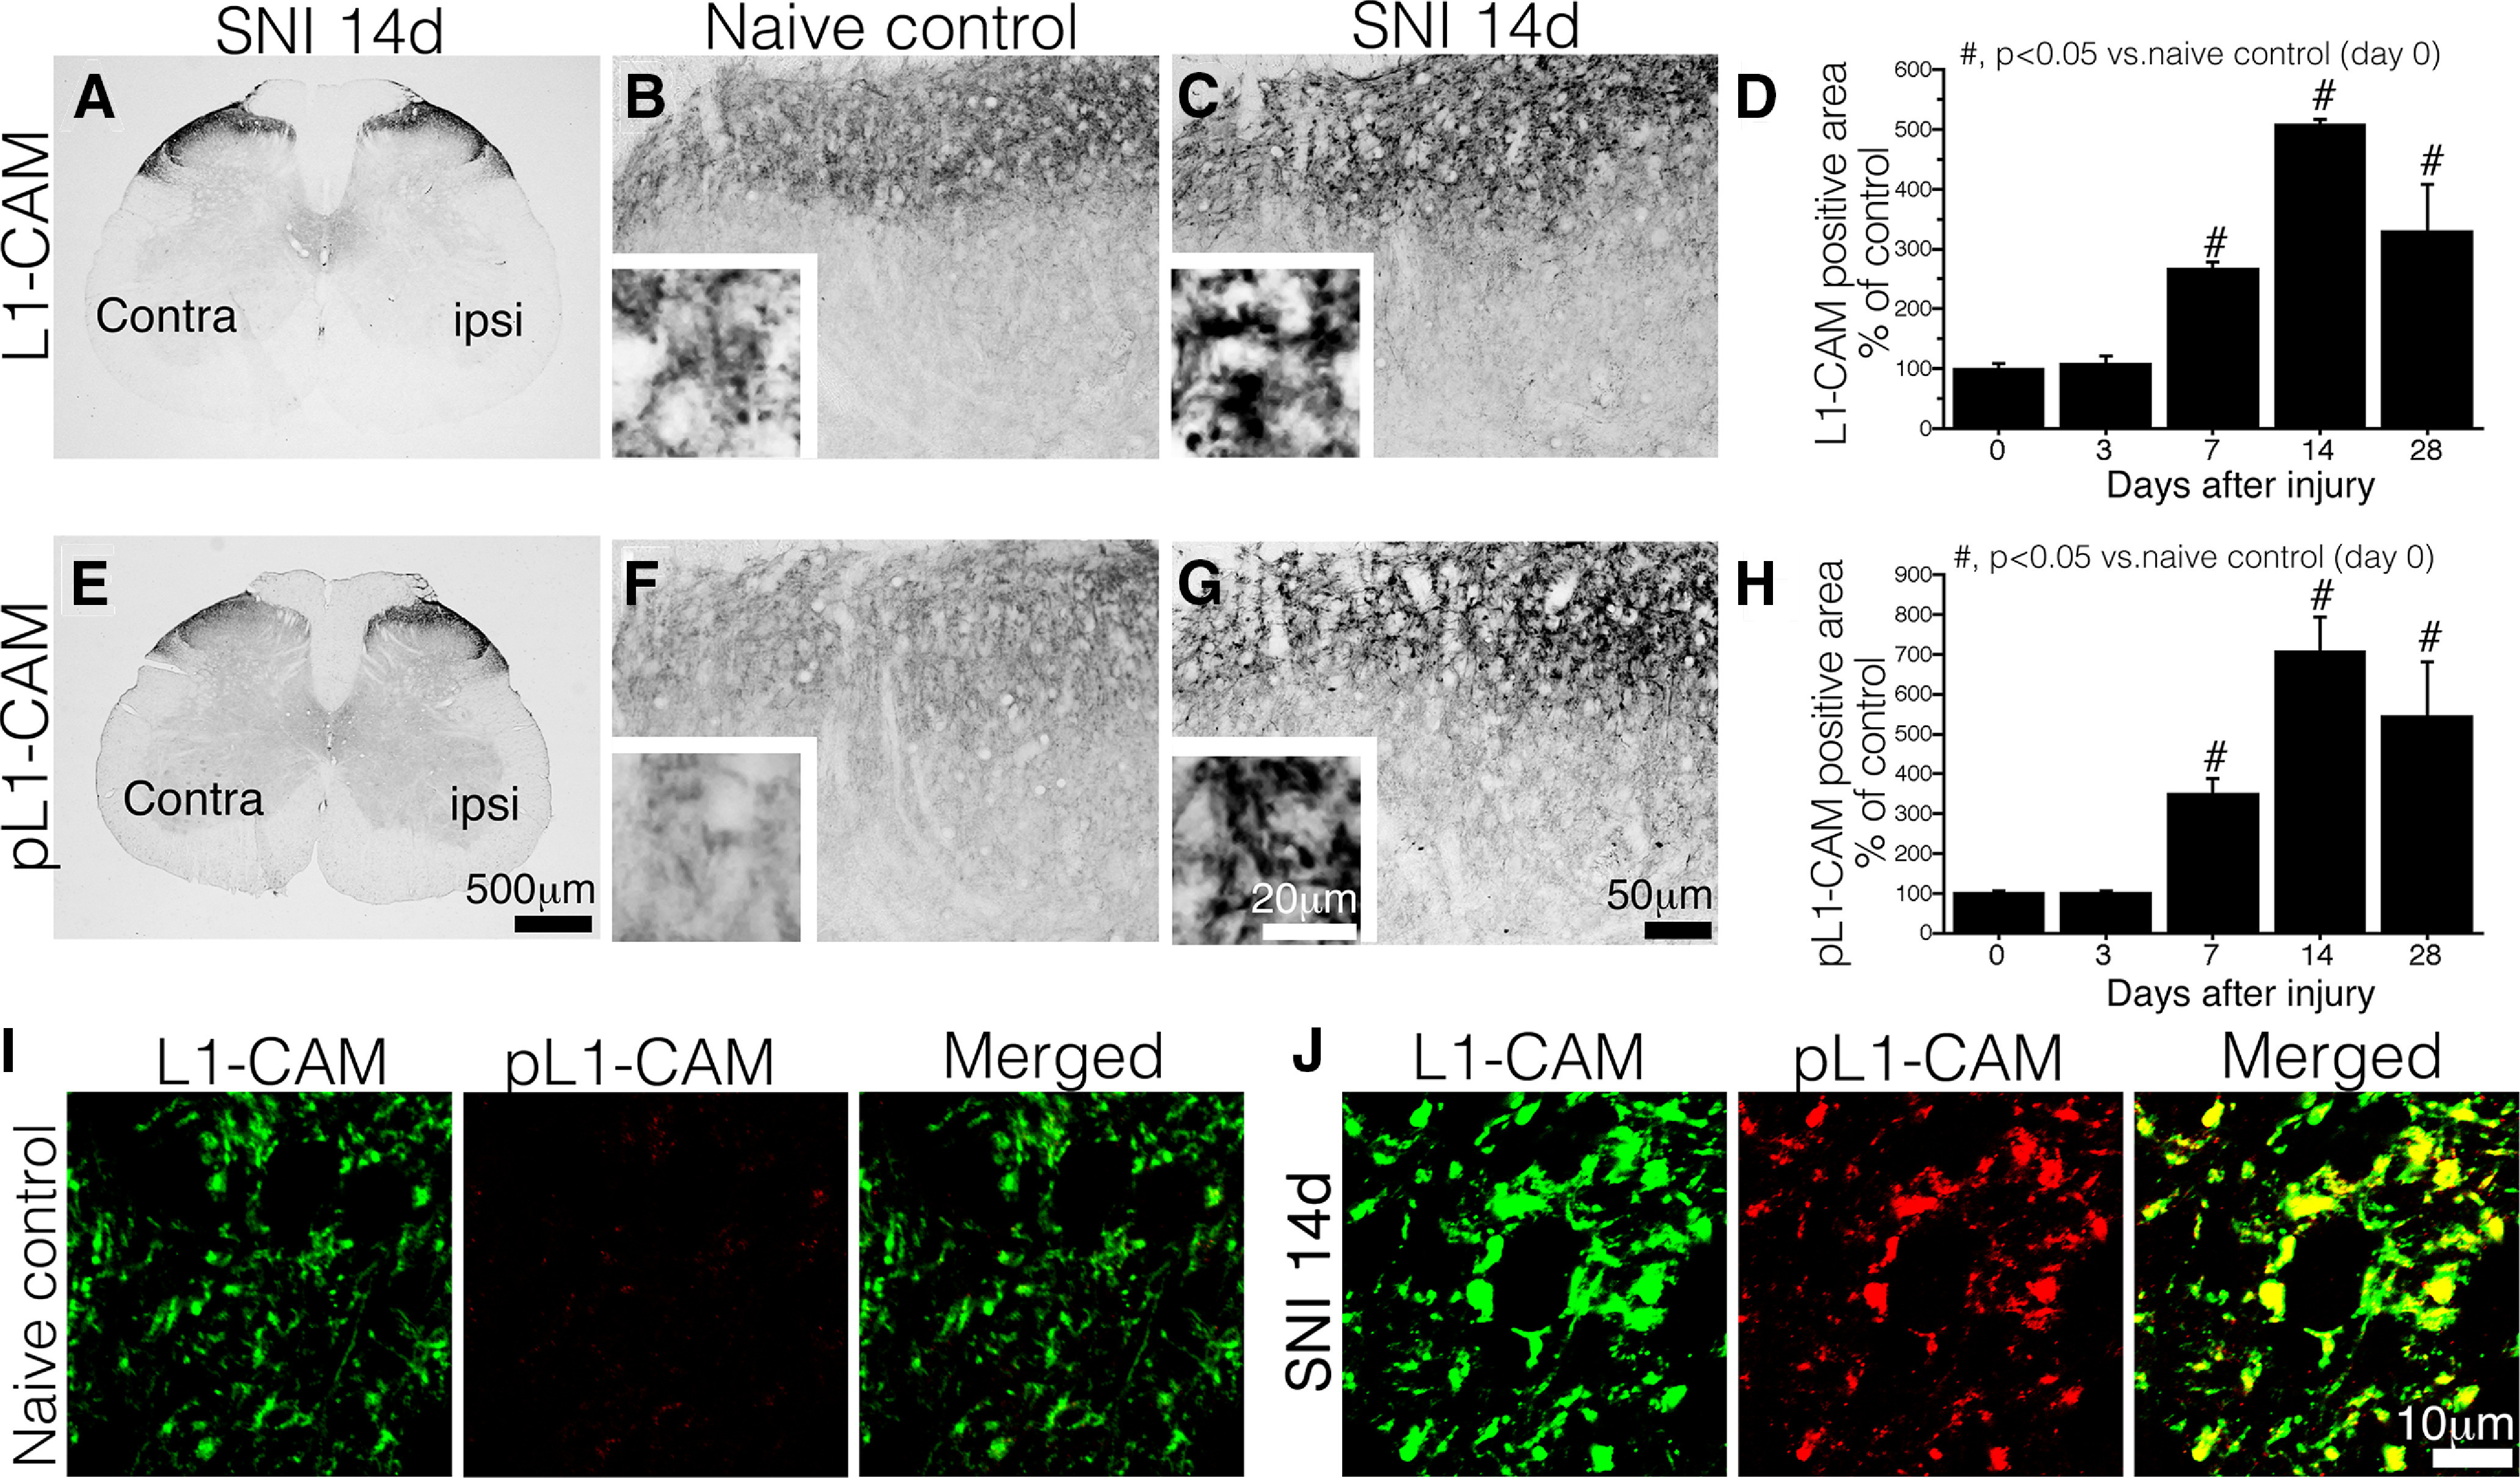
Figure 2.

Expression of tL1-CAM and pL1-CAM in the dorsal horn of the spinal cord. A–C, IHC of tL1-CAM. A, Low-magnification image of the SNI model, 14 d after injury. B, C, tL1-CAM-ir in Laminae I–II of naive control animals (B) and 14 d after injury in SNI model animals (C). Insets, High-magnification images in B, C. D, Quantification of tL1-CAM-ir in the dorsal horn of SNI model rats (n = 4 each time points). E–G, IHC of pL1-CAM. E, Low-magnification images of SNI model animals, 14 d after injury. F, G, pL1-CAM-ir in Laminae I–II of control animals (F) and 14 d after injury in SNI model animals (G). Insets, Magnified images of F, G. H, Quantification of pL1-CAM-ir in the dorsal horn of SNI model rats. I, J, High-magnification confocal double-labeled images of L1-CAM-ir/pL1-CAM in the dorsal horn of control animals (I) and SNI model animals (J). Scale bars: 500 μm (A, E), 50 μm (B, C, F, G), 20 μm (B, C, F, G, insets), and 10 μm (I, J); #p < 0.05 versus naive control animal.
