Figure 3.

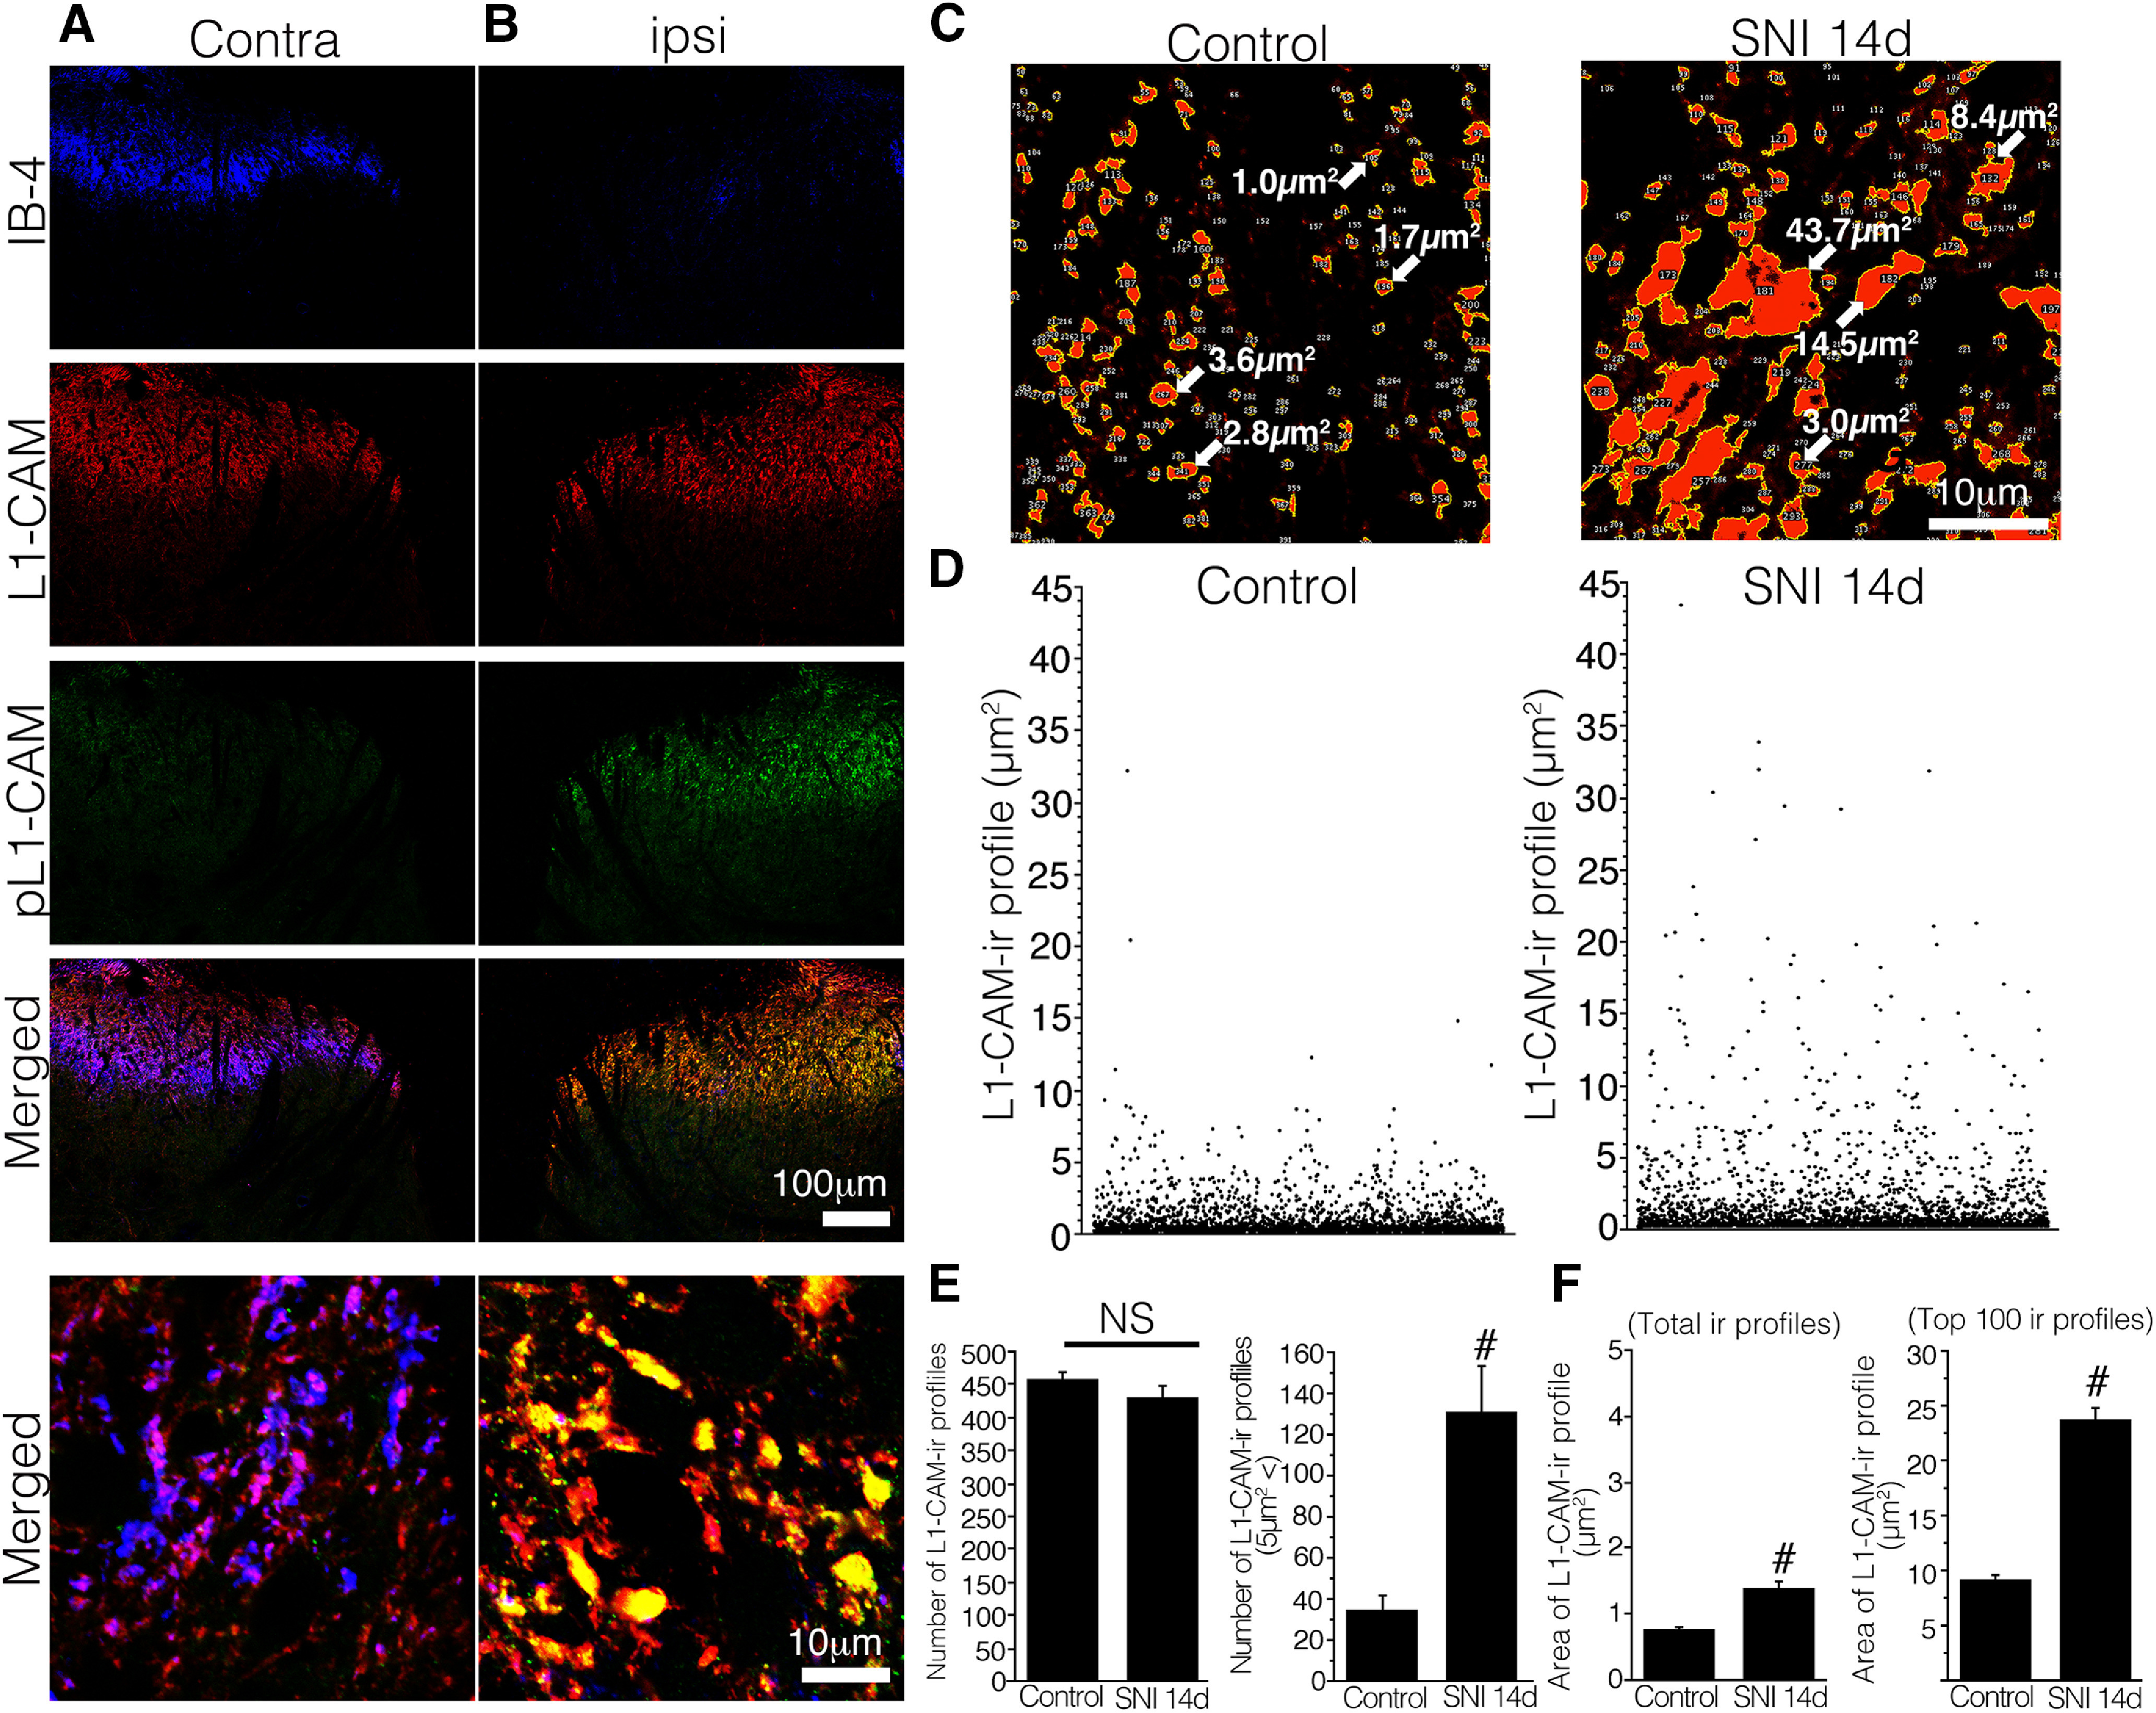
A, B, Triple-labeled images of IB-4 (blue), tL1-CAM (red), and pL1-CAM (green) in the L4/5 dorsal horn of SNI model rats, 14 d after injury. C–F, Quantification of tL1-CAM-ir profiles in the dorsal horn of the control (IB-4-positive area) and SNI models (IB-4-negative area). C, Binary images of tL1-CAM-ir in the dorsal horn of the control (left) and SNI models (right). Arrows indicate the area of each immunoreactive profile. D, Representative scatter plotting results of tL1-CAM-ir profiles of the control (left) and SNI models (right). Each dot represents a tL1-CAM-ir profile; y-axis represents the immunoreactive area. E, F, Quantification of tL1-CAM-ir profile numbers (E) and area (F). E, Average number of tL1-CAM-ir in the dorsal horn (4984 μm2 per animal, n = 4 total; 2049 and 1979 ir profiles from the control naive and SNI models, respectively). F, Average size of the total tL1-CAM-ir (E) and top 100 large-sized tL1-CAM-ir varicosities in the dorsal horn of the control and SNI models, 14 d after injury. Scale bars: 100 μm (A, B, low-magnification images) and 10 μm (A–C, high-magnification images). NS indicates not significant versus control, #p,0.05 versus control.
