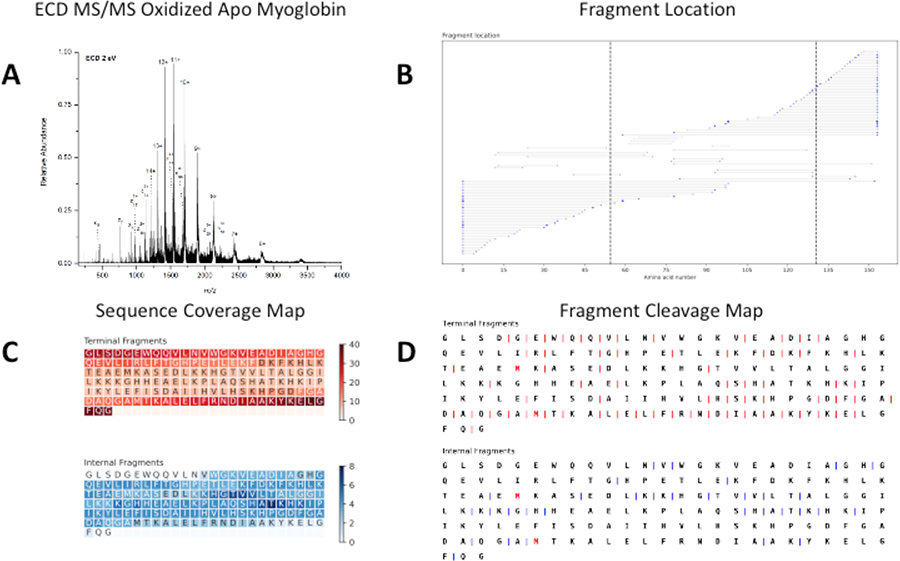
Figure 3.
A. Broadband ECD MS of 20 μM oxidized apo-myoglobin formed from acidic denaturing conditions. B. A fragment location map indicating the region of the protein sequence covered by terminal and internal fragments. Dashed lines indicate sites of oxidation. C. A sequence coverage map for the terminal and internal fragments assigned indicating terminal and internal fragments cover both oxidation sites. Darker regions indicate more coverage. D. A fragment cleavage map indicating the location of inter-amino acid cleavage sites for terminal and internal fragments. Red amino acids indicate sites of oxidation.

