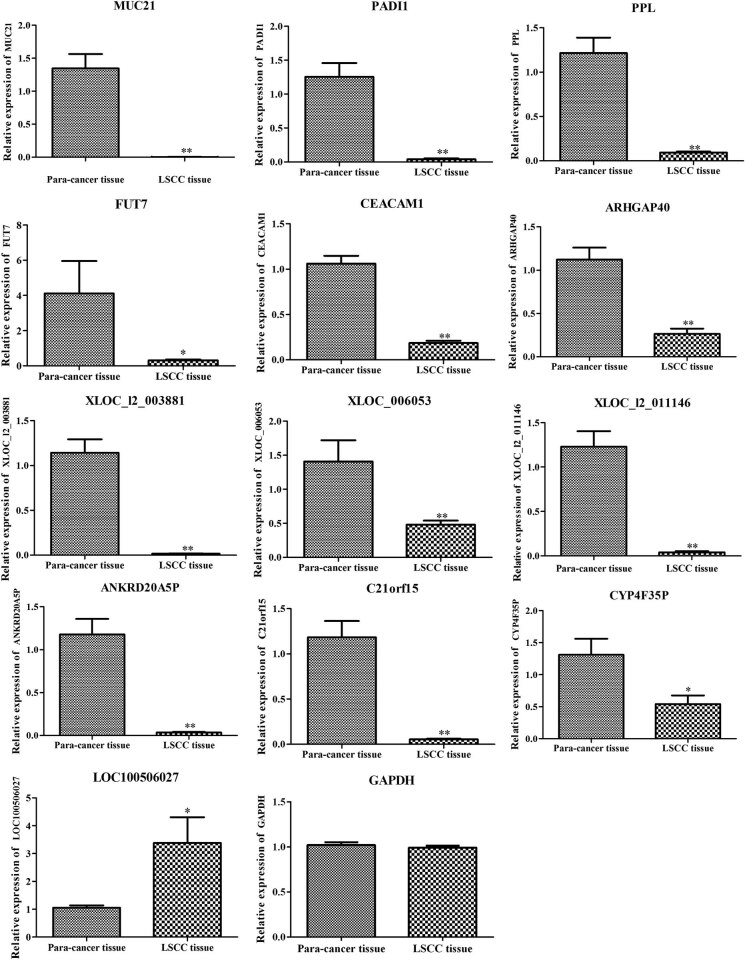
Figure 6.
Relative mRNA expressions of MUC21, PADI1, PPL, FUT7, CEACAM1, ARHGAP40, XLOC_I2_003881, XLOC_006053, XLOC_I2_011146, ANKRD20A5P, C21orf15, CYP4F35P, LOC100506027, and GAPDH in LSCC tissues compared with adjacent tissues detected by real-time quantitative polymerase chain reaction. ** represents p < 0.01, and * represents p < 0.005 between LSCC and adjacent tissues samples.

