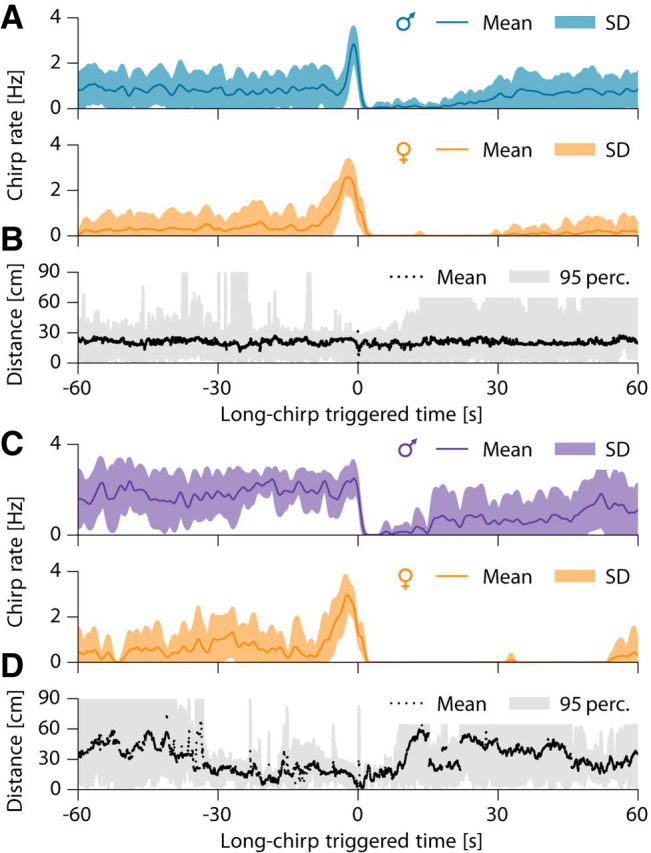
Figure 5.

Temporal structure of courtship chirping of two example pairs. A, Average rate of small chirps of a male (top, EODf = 930 Hz) courting a female (bottom, EODf = 620 Hz, n = 32 episodes, same pair as in Fig. 3, beat frequency is 310 Hz). B, Corresponding distance between the courting male and female. C, D, Same as in A and B for the pair shown in Figure 2 (same female as in A and B, male EODf = 1035 Hz, beat frequency 415 Hz, n = 8 episodes). Time 0 marks the female long chirp. Bands mark 95% percentiles. See Figure 5-1, for corresponding interchirp-interval distributions and Figure 5-2, for corresponding raster plots of small chirps.
