
FIGURE 2.
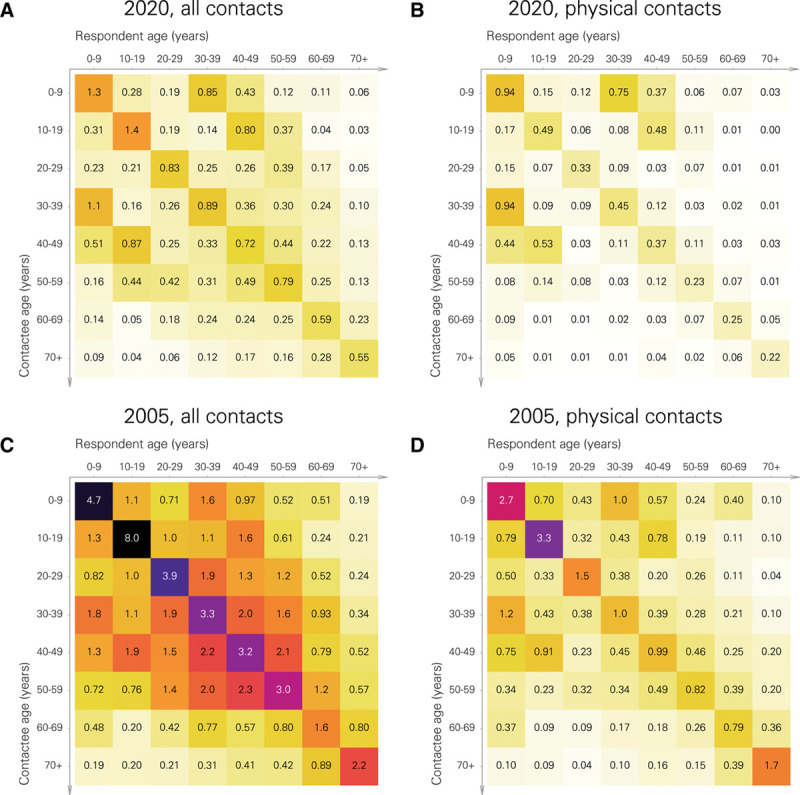
Mean numbers of daily contacts between the eight 10-year age classes in April 2020 and under normal conditions, Finland. A, All contacts (April 2020); B, physical contacts (April 2020); C (all contacts, Polymod data); D (physical contacts, Polymod data). The respondent’s age class (years) is on the top row. The rows correspond to contactees age classes (years). The numbers are posterior expectations of the mean numbers of contacts  . See eTables 1; http://links.lww.com/EDE/B806 and 3; http://links.lww.com/EDE/B806 for the 95% posterior intervals of the mean numbers as given in the April 2020 matrices.