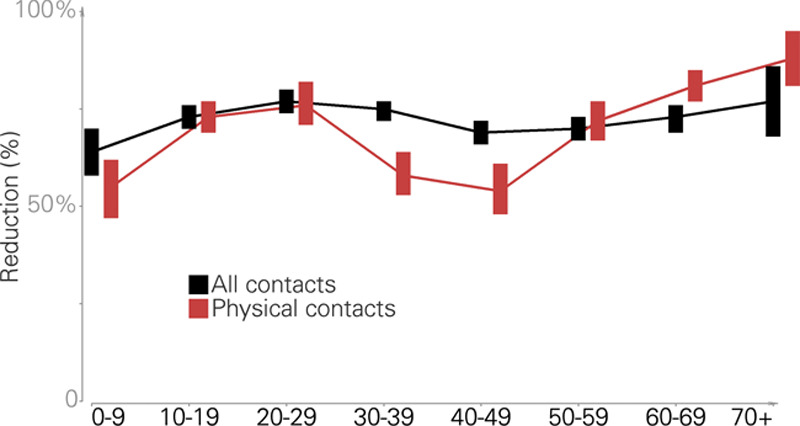
FIGURE 3.

Age-class-specific relative reductions in the mean numbers of daily contacts when comparing April 2020 (strong social distancing) with the normal conditions as based on the Polymod survey data. The posterior means and 95% credible intervals are shown. Black = all contacts; red = physical contacts.
