
Figure 2.
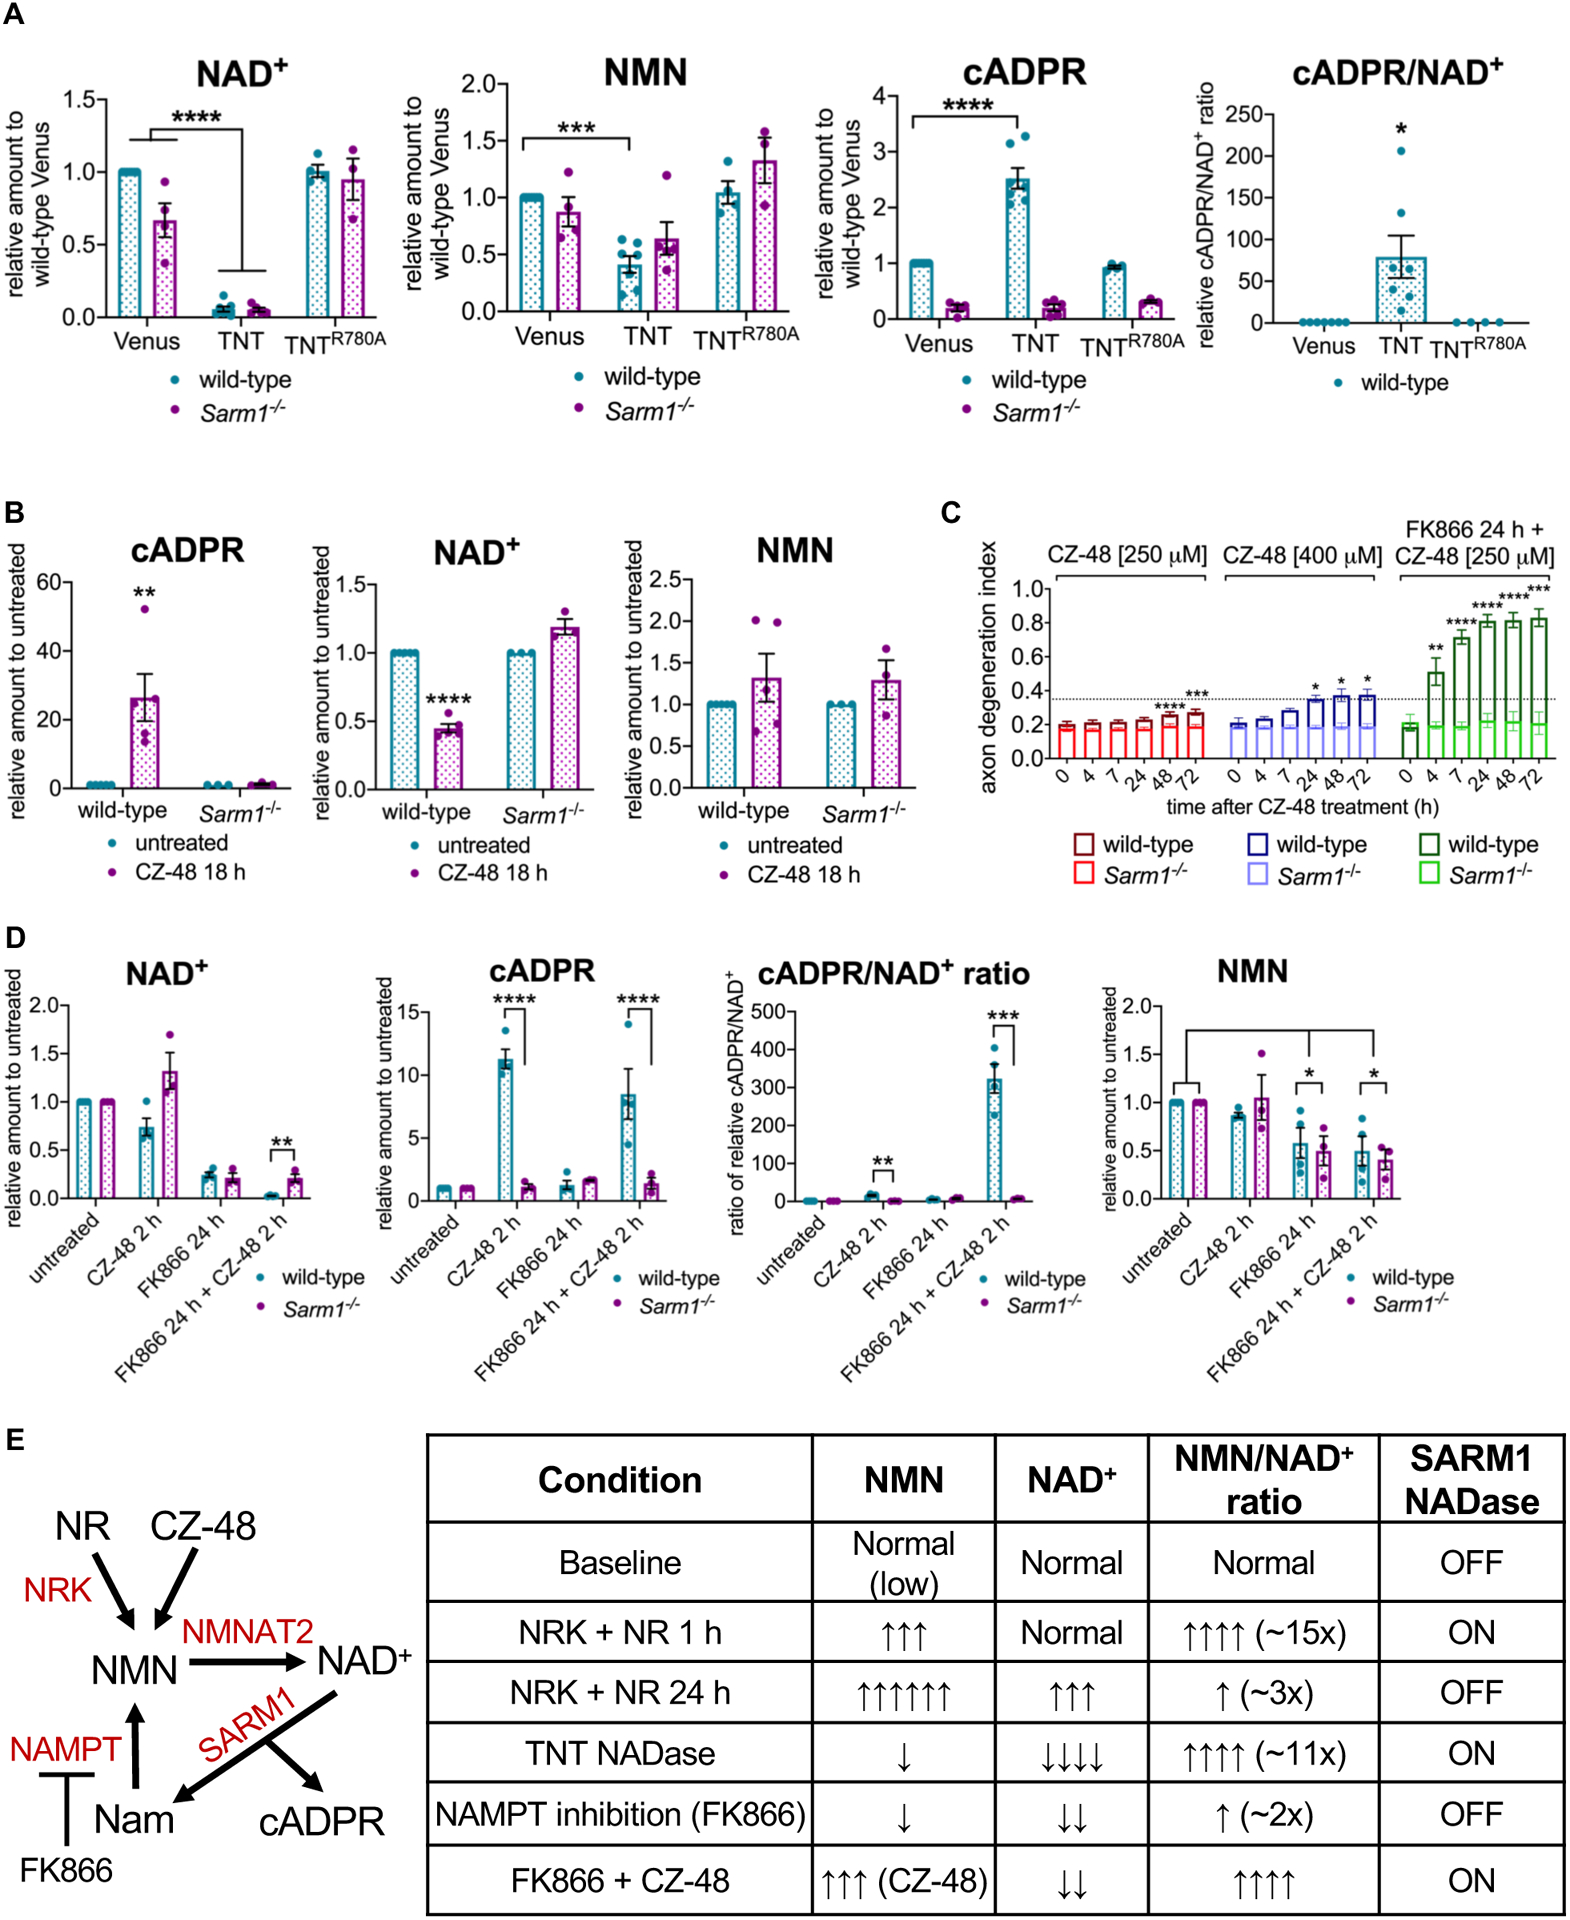
NMN/NAD+ ratio controls SARM1 activation in neurons.
A NAD+, NMN, cADPR levels and the relative cADPR/NAD+ ratios from primary eDRG neurons from wild-type or Sarm1−/− mice expressing Venus control, TNT or TNTR780A after four days, relative to Venus control, measured by LC-MS-MS. Data correspond to means from replicate experiments and error bars denote ±SEM. Statistical significance was determined by two-way ANOVA with Dunnett’s multiple comparison test, comparing each condition to Venus-expressing control neurons. * denotes P value=<0.05; **=<0.01; ***=<0.001; ****=<0.0001.
B cADPR, NAD+ and NMN levels from primary eDRG neurons from wild-type or Sarm1−/− mice, after treatment with CZ-48 [250 μM] for 18 h, relative to untreated control, measured by LC-MS-MS. Data correspond to means from replicate experiments and error bars denote ±SEM. Statistical significance was determined by multiple unpaired t-tests with corrections for multiple comparisons using the Holm-Sidak method. * denotes P value=<0.05; **=<0.01; ***=<0.001; ****=<0.0001.
C Axon-degeneration time course after treatment with CZ-48 [250 or 400 μM] or 24 h pre-treatment with FK866 [100 nM] + CZ-48 [250 μM], in primary eDRG neurons from wild-type or Sarm1−/− mice, and quantified as degeneration index (DI), where a DI of 0.35 or above represents degenerated axons. Data correspond to means from replicate experiments and error bars denote ±SD. Statistical significance was determined by two-way ANOVA with Dunnett’s multiple comparison test, comparing each time-point to time 0 h within each condition. * denotes P value=<0.05; **=<0.01; ***=<0.001; ****=<0.0001.
D NAD+ and cADPR and NMN levels, and relative cADPR/NAD+ ratio from primary eDRG neurons from wild-type or Sarm1−/− mice after treatment with 2 h CZ-48 [250 μM], FK866 24 h [100 nM], or FK866 24 h [100 nM] + 2 h CZ-48 [250 μM], relative to untreated control, measured by LC-MS-MS. Data correspond to means from replicate experiments and error bars denote ±SEM. Statistical significance was determined by unpaired t-tests with corrections for multiple comparisons using the Holm-Sidak method, comparing wild-type to Sarm1−/− for each condition (NAD+, cADPR, and cADPR/NAD+), or two-way ANOVA with correction for multiple comparisons using the Holm-Sidak method, comparing each condition to untreated within each genotype (NMN). * denotes P value=<0.05; **=<0.01; ***=<0.001; ****=<0.0001.
E Schematic of NAD+ pathway and experimental manipulations used in Figures 1 and 2. A summary table of experimental conditions from Figures 1 and 2 and their effects on NMN and NAD+ levels, the NMN/NAD+ ratio, and SARM1 NADase activity.
See also Figure S2.