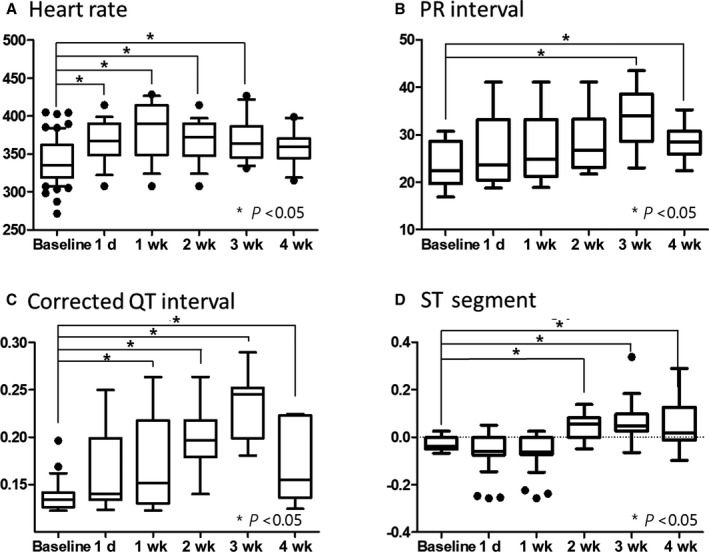
Figure 6. ECG changes.

Average values of 10 measurements of randomly selected beats during a 1‐minute recording were determined. The sample size was 15 per group at each time point. A, Resting heart rate was increased after irradiation compared with baseline measurements. B, The PR interval, representing the conduction velocity from atrium to ventricle, was slightly delayed and peaked at 3 weeks. C, The corrected QT interval, representing the intraventricular conduction property, was prolonged relative to baseline. D, The ST segment was depressed after irradiation but elevated after 2 weeks in most cases. The statistical difference between groups was calculated using 1‐way ANOVA with Dunnett post hoc analysis.
