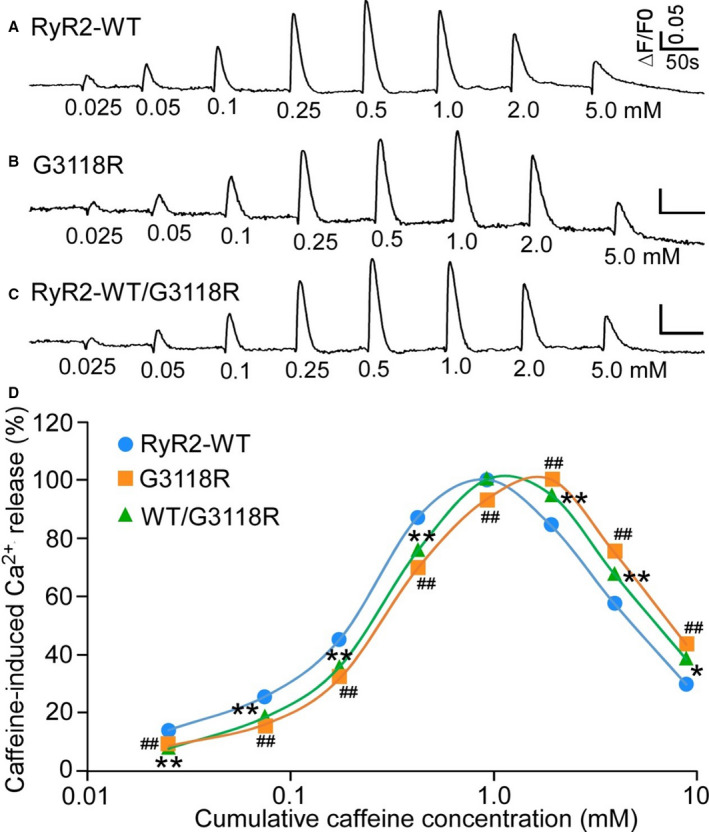
Figure 3. Effect of RyR2‐G3118R on caffeine‐induced Ca2+ release.

HEK293 cells were transfected with RyR2 WT (A) or G3118R (B), or cotransfected with RyR2‐WT and G3118R (C). The fluorescence intensity of the fluo‐3‐loaded transfected cells was monitored continuously before and after each caffeine addition. The amplitude of each caffeine peak was normalized to that of the maximum peak for each experiment. D, The relationships between caffeine‐induced Ca2+ release and cumulative caffeine concentrations in HEK293 cells transfected with RyR2‐WT or G3118R, or cotransfected with RyR2‐WT/G3118R. Data were calculated using 1‐way ANOVA with a Dunnett's post hoc test, expressed as mean±SEM from RyR2 WT (n=7), G3118R (n=9), and RyR2‐WT/G3118R (n=7). (*P<0.05, **P<0.01, ## P<0.01, vs WT). WT, wild‐type.
