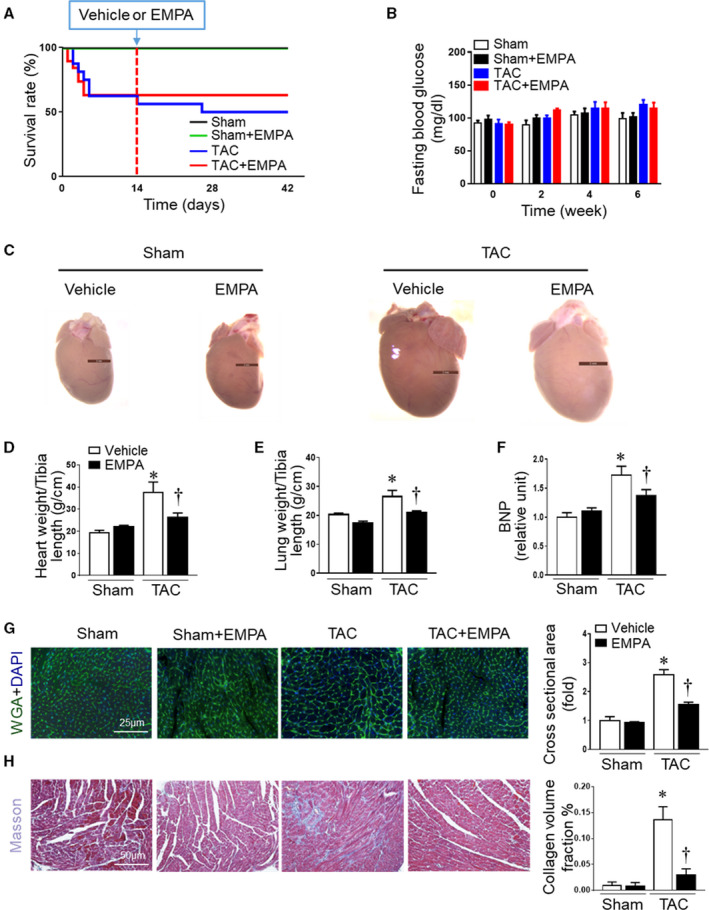
Figure 1. Empagliflozin treatment attenuated cardiac remodeling caused by transverse aortic constriction (TAC).

(A) Survival curve in different groups of mice after sham or TAC surgery subjected to vehicle or empagliflozin treatment (n=10–19). (B) Fasting blood glucose concentration among groups during baseline (time 0), 2, 4, and 6 weeks after surgery. Mice were fasted overnight, and blood glucose concentration was measured biweekly (n=10–19). There was no difference among any of the groups. (C) Representative hearts from sham+vehicle, sham+empagliflozin, TAC+vehicle, and TAC+empagliflozin mice at the end of experiments. (D) Dry heart weight and (E) lung weight in different groups (n=5–6). (F) Quantitative analysis of serum B‐type natriuretic peptide (n=6). (G) Left: Cardiomyocytes sizes were outlined by wheat germ agglutinin staining. Right: Quantitative analysis of wheat germ agglutinin staining (n=6). (H) Cardiac fibrosis was measured by Masson staining. Left: representative images of Masson staining. Right: quantitative analysis (n=6), Results are expressed as mean±SEM. TAC indicates transverse aortic constriction; BNP, B‐type natriuretic peptide; DAPI, 4′,6‐diamidino‐2‐phenylindole; and WGA, wheat germ agglutinin. *P<0.05 vs sham, † P<0.05 vs TAC. Log‐rank test (A). One‐way ANOVA (non‐repeated measures) (B and D–H).
