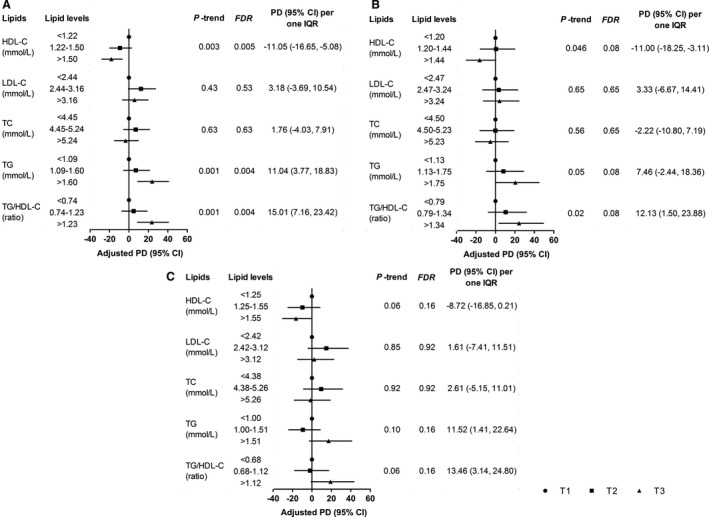
Figure 2. Associations of lipid traits with plasma miR‐4286 in the validation stage.

Forest plots of A, B, and C separately show the associations of lipid traits with plasma miR‐4286 among all participants, incident ACS cases, and controls. Adjusted PD (95% CI) for plasma miR‐4286 was obtained using multivariable linear regression model with adjustment for age, sex, body mass index, smoking status, drinking status, education levels, metabolic equivalent, and use of lipid‐lowering medication. P‐trend was estimated by assigning the median value of lipid to each tertile and using this as a continuous variable in the linear regression model. ACS indicates acute coronary syndrome; FDR, false discovery rate; HDL‐C, high‐density lipoprotein cholesterol; IQR, interquartile range; LDL‐C, low‐density lipoprotein cholesterol; PD, percent difference; TC, total cholesterol; and TG, triglyceride.
