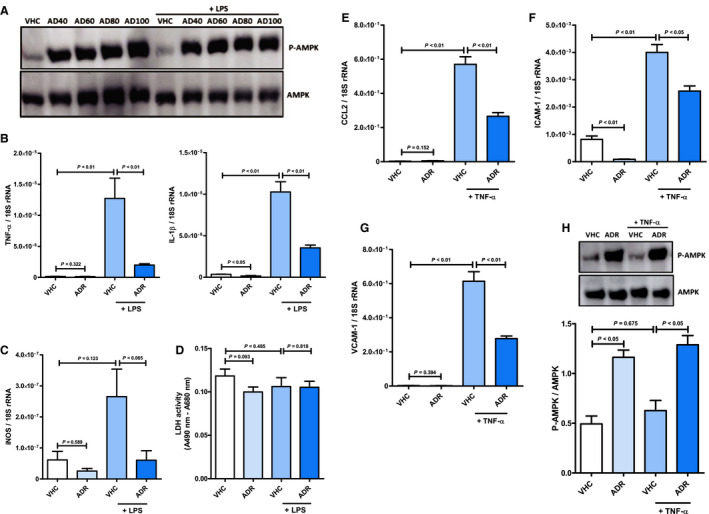
Figure 8. AdipoRon inhibits the emergence of a systemic inflammatory response syndrome–associated inflammatory phenotype in vascular endothelial cells.

Vascular endothelial cells were preincubated with AdipoRon (concentration range 40–100 µmol/L) or vehicle (dimethyl sulfoxide) for 2 hours before stimulation with lipopolysaccharide (1 mg/mL) for 1 hour. A, Phosphorylation status of AMP‐activated protein kinase (AMPK; molecular weight: 62 kDa) in cell lysates was quantified by immunoblot (n=2). Vascular endothelial cells were preincubated with AdipoRon (80 µmol/L) or vehicle for 2 hours before stimulation with lipopolysaccharide (1 mg/mL) for 1 hour. mRNA expression of (B) the cytokines TNF‐α (tumor necrosis factor α) and IL (interleukin) 1β and (C) the enzyme inducible nitric oxide synthase (iNOS) was measured by quantitative real‐time polymerase chain reaction (n=6). D, The content of lactate dehydrogenase (LDH) in culture supernatants was quantified by activity assay (n=6). Vascular endothelial cells were preincubated with AdipoRon (80 µmol/L) or vehicle for 2 hours before stimulation with TNF‐α (10 ng/mL) for 1 hour. mRNA expression of (E) the chemokine CCL2 (C‐C chemokine ligand 2) and the adhesion molecules (F) intercellular adhesion molecule 1 (ICAM‐1) and (G) vascular cell adhesion molecule 1 (VCAM‐1) was measured relative to 18S ribosomal RNA (rRNA) by quantitative real‐time polymerase chain reaction (n=6). H, Phosphorylation of AMPK in cell lysates was analyzed by immunoblot (n=5). Upper panel: representative pictures of the resulting phosphorylated AMPK (P‐AMPK; molecular weight: 62 kDa) and AMPK (molecular weight: 62 kDa) band patterns. Lower panel: column bars indicate quantified P‐AMPK/AMPK expression ratios. Results are presented as mean+SEM. Differences of marker expression levels between experimental groups were analyzed statistically by performing the indicated pairwise comparisons.
