
Figure 3. Thirty‐day and 1‐year mortality following mitral valve‐in‐valve (MVIV) replacement.
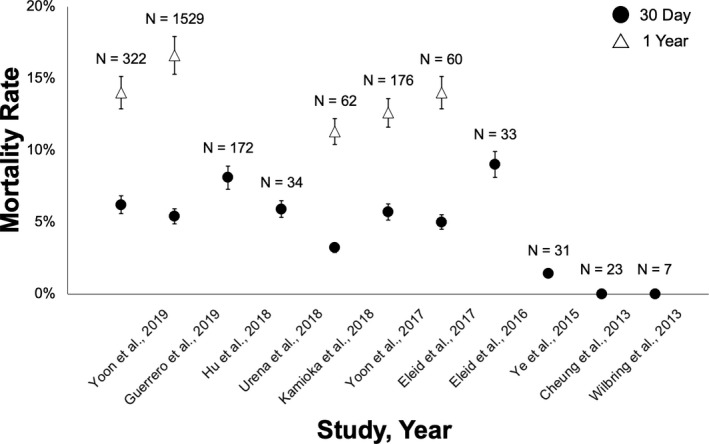
Mortality rates at 30 days and 1 year are shown among the various MVIV series evaluated, in descending chronological order of year of publication. The error bars indicate the 95% CIs. 26 , 27 , 28 , 29 , 30 , 31 , 32 , 33 , 34 , 35 , 36