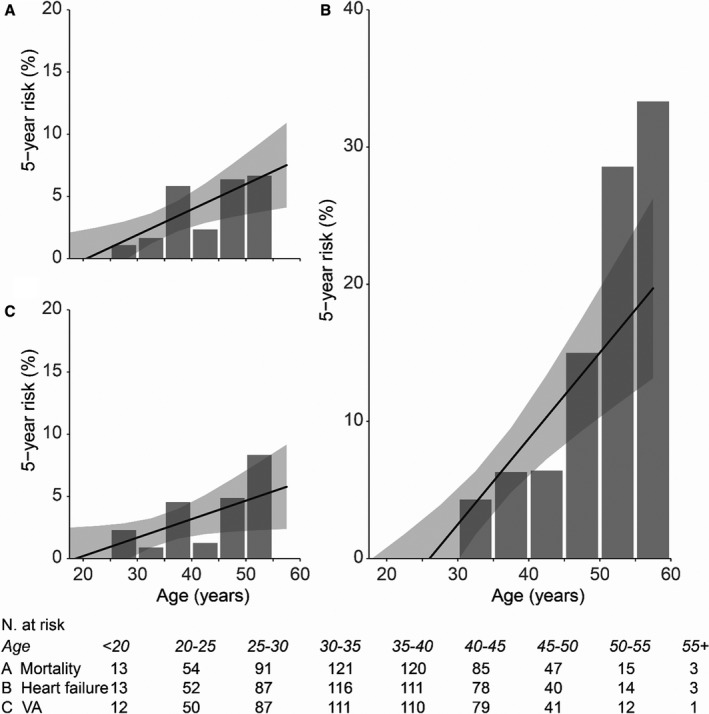
Figure 1. Five‐year risk of first events.

Five‐year risk of all‐cause mortality (A), first heart failure event (B), and first ventricular arrhythmia (VA) event (C). The bars show the observed incidence in percentage of patients at risk per age group, and the black line shows the predicted risk based on the observed incidences, assuming a linear model. N. indicates number.
