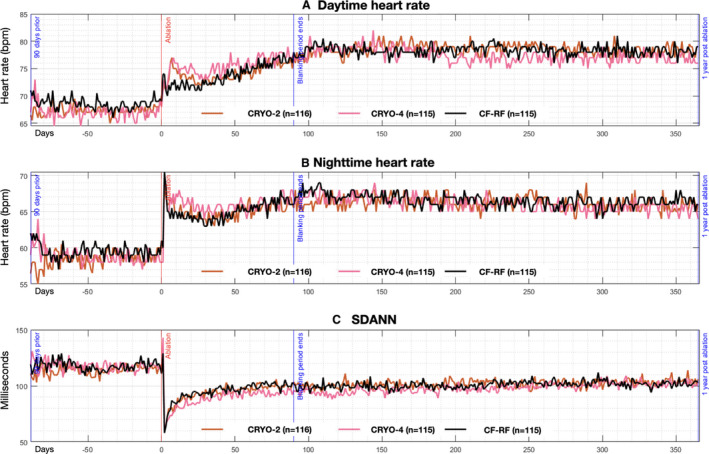
Figure 2. Autonomic alterations pre‐ and post‐pulmonary vein isolation, stratified by randomized group.

Pictured are median values of the daytime heart rate (A), nighttime heart rate (B), and the SD of the average normal‐to‐normal intervals (C). Date of ablation is noted as time zero on the Y axis, with a range of −91 days before ablation, and +366 days post‐ablation. Black line depicts patients randomized to contact‐force radiofrequency ablation, red line depicts those randomized to short duration cryoablation, and pink line depicts those randomized to standard duration cryoablation. CRYO indicates cryoballoon ablation; SDANN, SD of the average normal‐to‐ normal.
