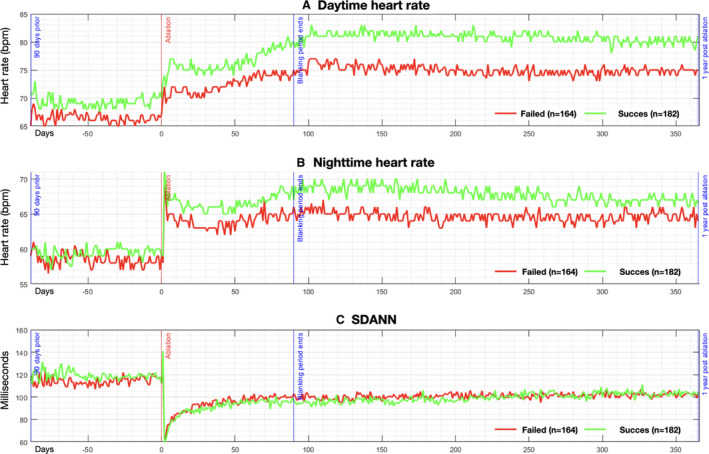
Figure 3. Autonomic alterations pre‐ and post‐pulmonary vein isolation, stratified by procedural outcome.

Pictured are median values of the daytime heart rate (A), nighttime heart rate (B), and the SD of the average normal‐to‐normal intervals (C). Date of ablation is noted as time zero on the y‐axis, with a range of −100 days before ablation, and +365 days post‐ablation. Red line depicts patients with recurrence of atrial fibrillation/atrial flutter/atrial tachycardia, and green line depicts patients free of arrhythmia recurrence.
