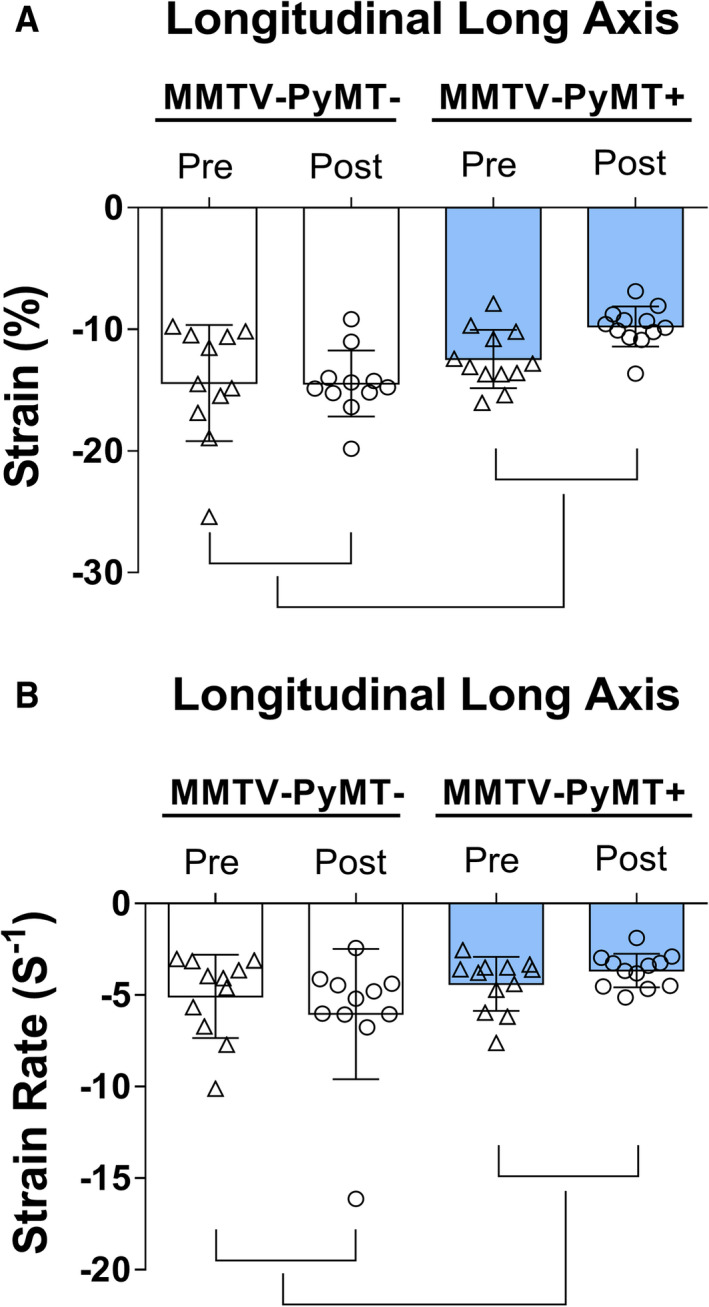
Figure 3. Cardiac function by speckle tracking in mouse mammary tumor virus–polyomavirus middle T antigen (MMTV‐PyMT)− and MMTV‐PyMT+—longitudinal long‐axis strain (A) and strain rate (B).

Longitudinal strain (P group<0.001, P interaction=0.126) and strain rate (P group=0.030, P interaction=0.168) were lower in MMTV‐PyMT+ mice when compared with MMTV‐PyMT− mice. Pre: pre phase tumor growth and post: post phase tumor growth. Generalized estimation equations with normal distribution and identity link function using AR(1) correlation matrix between evaluations. Values are expressed as means and SD. Three mice in the MMTV‐PyMT− and 3 mice in the MMTV‐PyMT+ groups were excluded from the speckle‐tracking analysis because of poor imaging quality. Thus, 11 mice in the MMTV‐PyMT− and 12 mice in the MMTV‐PyMT+ were involved in this analysis.
