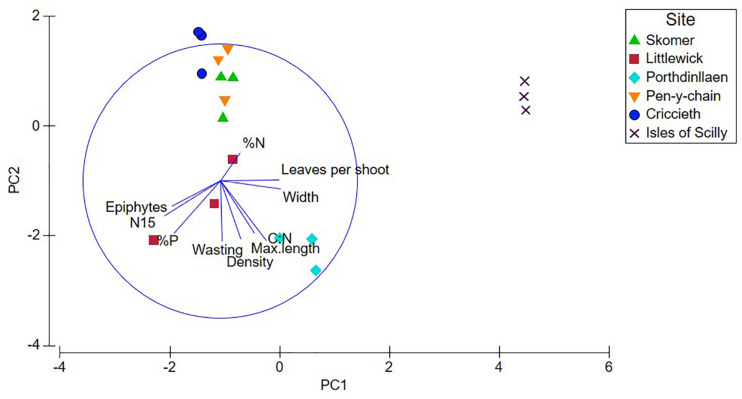
FIGURE 3.
Principal Components Analysis (PCA) plots for shoot, nutrient, and stable isotope data for each site, plotted with shoot density and metrics (max. leaf length, width, and leaves per shoot). Nutrient data for Isles of Scilly provided from Jones et al. (2018).

