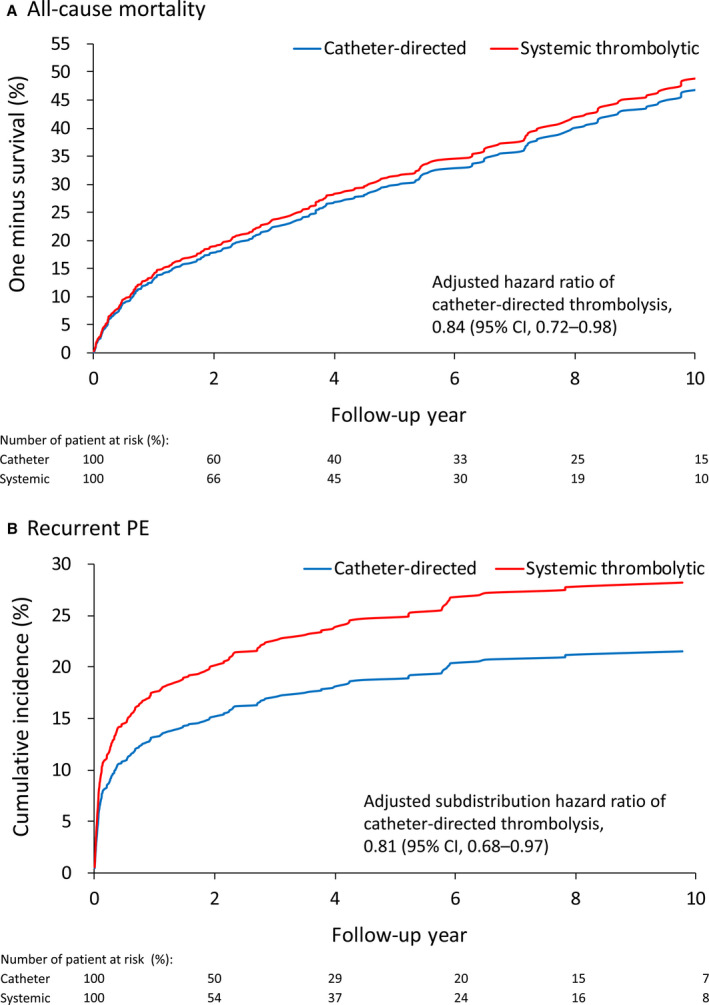
Figure 2. Fitted survival curves of all‐cause mortality (A) and fitted cumulative incidence function of recurrent pulmonary embolism (PE) (B) of patients treated with catheter‐directed thrombolysis or systemic thrombolytic therapy in the inverse probability of treatment weighting–adjusted cohort.

