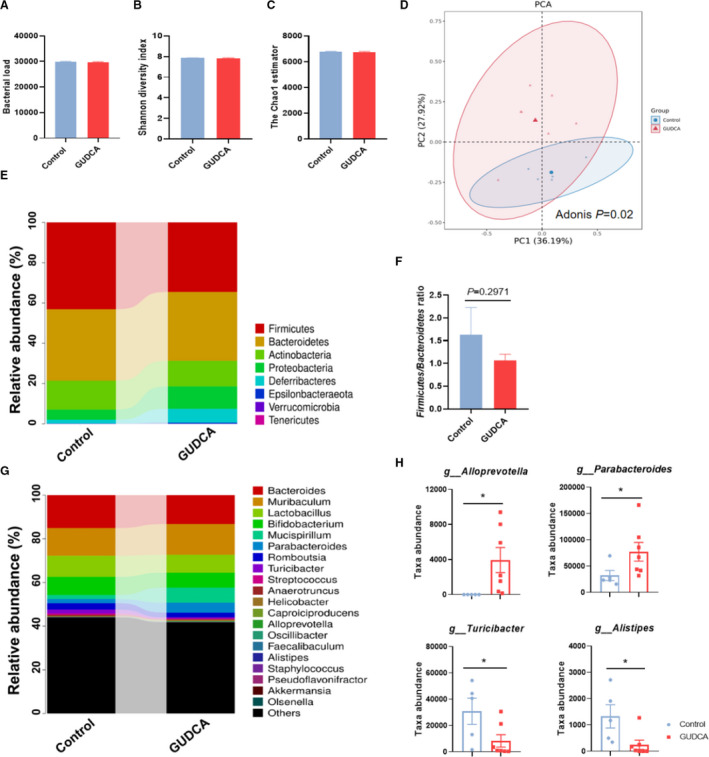
Figure 4. GUDCA administration alters the composition of gut microbiota in ApoE‐/‐ mice.

Feces of each mouse were collected after 12 weeks of treatment with or without GUDCA, and analyzed by utilization of 16S rDNA sequencing on V4 region. A, Operational taxonomic unit abundance in the feces between control and GUDCA. B, Shannon diversity index; and C, the Chao1 estimator in α‐diversity analysis. Data are shown as mean±SEM. D, Principal component analysis (PCA) from each group. The dissimilarity was calculated by using unweighted adonis test. E, Microbiota compositions at the phylum level. F, Representative of the Firmicutes/Bacteroidetes ratio between groups. Data are shown as mean±SEM. G, Microbiota compositions at the genus level. H, Disparate microbial genus between control and GUDCA mice were assessed by Metastats analysis. The symbols indicate values for each mouse, with bars represent mean±SEM. n=5 in Control group, n=7 in GUDCA group. *P<0.05, **P<0.01, and ***P<0.001 vs control. ApoE‐/‐ indicates apolipoprotein E–deficient; and GUDCA, glycoursodeoxycholic acid.
