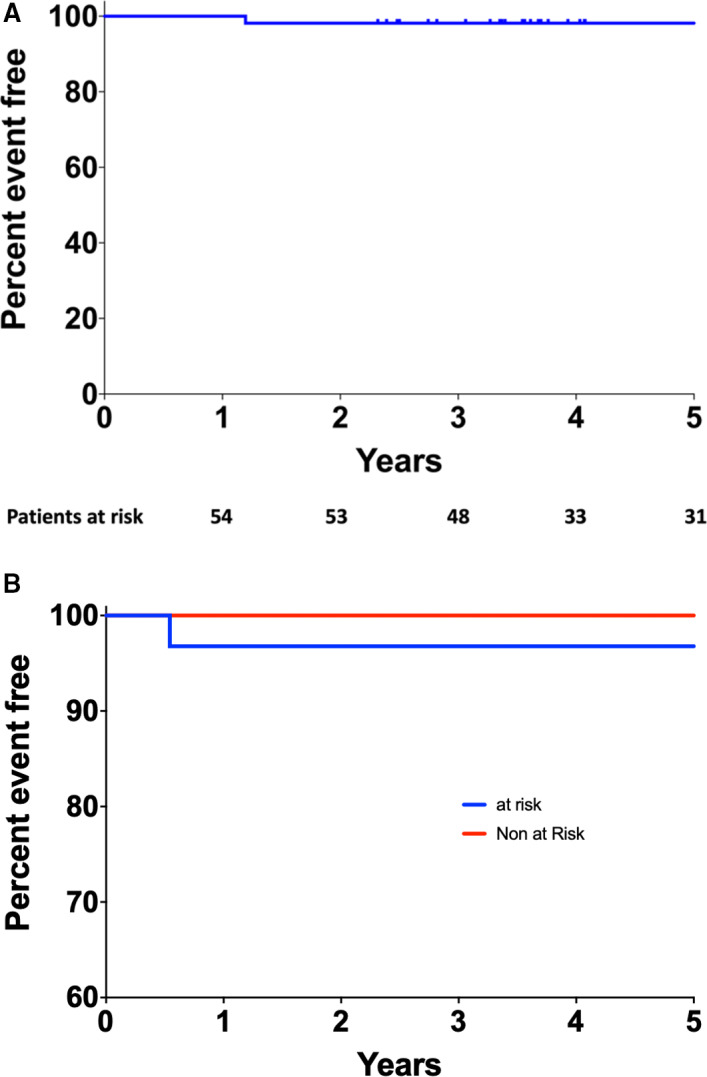
Figure 5. Kaplan‐Meier curve of event‐free rate of patients at 5 years of follow‐up in the overall population and according to the anatomical feature at risk.

A, Kaplan‐Meier curve of event‐free rate of patients at 5 years of follow‐up. Number of patients at risk are presented below in the figure. B, Kaplan‐Meier curves of event‐free rate of patients at 5 years of follow‐up, according to anatomical feature at risk. No statistical differences were observed with log‐rank test (P=0.39).
