

Abstract
Background
It is unclear what office blood pressure (BP) is the optimal treatment target range in patients with hypertension.
Methods and Results
Using the Korean National Health Insurance Service database, we extracted the data on 479 359 patients with hypertension with available BP measurements and no history of cardiovascular events from 2002 to 2011. The study end point was major cardiovascular events (MACE), a composite of cardiovascular death, myocardial infarction, or stroke. This cohort study evaluated the association of BP levels (<120/<70, 120–129/70–79, 130–139/80–89, 140–149/90–99, and ≥150/≥100 mm Hg) with MACE. During a median follow‐up of 9 years, 55 401 MACE were documented in our cohort. The risk of MACE was the lowest (adjusted hazard ratio [HR], 0.79; 95% CI, 0.76–0.84) at BP level of <120/<70 mm Hg, and was the highest (HR, 1.32; 95% CI, 1.29–1.36) at ≥150/≥100 mm Hg in comparison with 130 to 139/80 to 89 mm Hg. These results were consistent in all age groups and both sexes. Among patients treated with antihypertensive medication (n=237 592, 49.5%), in comparison with a BP level of 130 to 139/80 to 89 mm Hg, the risk of MACE was significantly higher in patients with elevated BP (≥140/≥90 mm Hg), but not significantly lower in patients with BP of <130/<80 mm Hg. Low BP <120/70 mm Hg was associated with increased risk of all‐cause or cardiovascular death in all age groups.
Conclusions
BP level is significantly correlated with the risk of MACE in all Korean patients with hypertension. However, there were no additional benefits for MACE amongst those treated for hypertension with BP <120/70 mm Hg.
Keywords: blood pressure, cardiovascular events, hypertension
Subject Categories: Hypertension
Nonstandard Abbreviations and Acronyms
- MACE
major cardiovascular events
- NHIS
National Health Insurance Service
Clinical Perspective
What Is New?
Elevated office blood pressure (BP) (≥140/≥90 mm Hg) was significantly associated with increased major cardiovascular events in all patients with hypertension regardless of treatment with antihypertensive medication.
In all patients with hypertension, office BP of <130/<80 mm Hg was significantly associated with lower major cardiovascular events compared with ≥130/≥80 mm Hg; this result was consistent regardless of sex or age except in men aged ≥70 years.
There was no additional benefit of low BP <120/70 mm Hg in comparison with <140/<90 mm Hg for major cardiovascular events in patients treated with antihypertensive medication; this result was consistent in both men and women regardless of age.
What Are the Clinical Implications?
Results of current analyses suggest “the lower, the better” for the overall BP control in all patients with hypertension.
When we manage patients with hypertension with antihypertensive medication, BP target of <140/90 mm Hg appears to be reasonable for prevention of major cardiovascular events in clinical practice, and low BP <120/70 mm Hg might not be beneficial.
Elevated blood pressure (BP) is a modifiable risk factor for cardiovascular morbidity and mortality. 1 Previous guidelines recommended a target BP of <140/90 mm Hg to reduce cardiovascular events. 2 , 3 However, SPRINT (Systolic Blood Pressure Intervention Trial) has reported in 2015 that a systolic BP target of <120 mm Hg instead of <140 mm Hg lowers rates of major cardiovascular events (MACE) (fatal and non‐fatal) and death from any cause among patients without diabetes mellitus at high risk for cardiovascular events. 4 The 2017 American College of Cardiology/American Heart Association and the 2018 European Society of Cardiology/European Society of Hypertension guidelines recommended that the BP values should be 130/80 mm Hg or lower in most treated patients. 5 , 6 This recommendation was based on multiple meta‐analyses that found that, in comparison with standard BP reduction, more intense BP lowering significantly reduces the risk of stroke, coronary events, MACE, and cardiovascular mortality. 4 , 7 , 8 , 9 , 10 , 11 On the other hand, other studies have reported that lowering systolic BP to <130 mm Hg in general has no further benefit in terms of major cardiovascular events except that it may reduce the risk of stroke. 12 , 13 , 14
There are some debates about optimal target BP in treatment of patients with hypertension, and there is a lack of evidence about target BP in Asian populations. Therefore, in this nationwide population–based study, we evaluated the association of office BP treatment range with MACE.
Methods
Data Sources
This study used the National Health Information Database produced by the National Health Insurance Service (NHIS). The authors declare no conflict of interest with NHIS. The NHIS provides mandatory health insurance for all South Korean citizens, covering 97% of the Korean population. 15 The NHIS claim database includes data on demographic characteristics, diagnoses, prescriptions, health screening examination data (eg, health questionnaires and laboratory tests), and deaths. The details of the database are described elsewhere. 16 All diagnoses are recorded in the NHIS database using the International Classification of Diseases, Tenth Revision (ICD‐10) codes. The authors are restricted from sharing the data underlying this study because The Korean NHIS owns the data. This study was performed as a project between the Korean Society of Hypertension and the NHIS. Researchers who are not members of the collaboration can request access on the NHIS website (http://nhiss.nhis.or.kr). Details of this process and a provision guide are now available at https://nhiss.nhis.or.kr/bd/ab/bdaba032eng.do. This study was approved by the Institutional Review Board of Kangbuk Samsung Hospital (KBSMC 2020‐01‐043). The anonymized data set was provided to the researchers by the NHIS and the requirement for informed consent was waived.
Study Population
The cohort included 1 554 406 participants aged ≥19 years who underwent health screening twice within 4 years by 2002 and 2011. Among them, we extracted 611 320 individuals who were diagnosed with hypertension (I10–I13, I15) before the first health screening examination. Finally, we enrolled 479 359 individuals after excluding those who had experienced myocardial infarction (I21–I23) or stroke (I60–I64) (n=62 039), were diagnosed with malignancy (C00–C99) (n=55 025) between the first and second health screenings, and whose data on baseline variables were missing (n=14 897). Individuals were followed up until death from any cause or the end of the study (December 2017), or censored when cardiovascular death, myocardial infarction, or stroke developed. Figure 1 shows a flowchart of the study population. We defined patients treated for hypertension as patients who were prescribed antihypertensive medications including angiotensin‐converting enzyme inhibitors, angiotensin II receptor blockers, beta‐adrenergic blockers, calcium channel blockers, or diuretics every year between the first and second health screenings.
Figure 1. Flowchart of the study population.

Blood Pressure and End Point
BP was measured using either sphygmomanometers or oscillometric devices after 3 to 5 minutes of rest. The staff who performed the measurements was recommended to choose a cuff of appropriate size, and to repeat measurements ≥2 times at 1‐to‐2‐minute intervals. Baseline BP was defined as the mean values of 2 BP measurements during different health screenings, which we assumed to be representative of the overall BP levels. The study participants were categorized arbitrary into 5 groups according to systolic and/or diastolic BPs (<120 and <70 [extremely intensive BP reduction group], 120–129 and/or 70–79 [intensive BP reduction group], 130–139 and/or 80–89 [standard BP reduction group], 140–149 and/or 90–99 [lenient group], ≥150 and/or ≥100 mm Hg [uncontrolled group]) (Figure S1). This categorization of the participants was based on the US guideline 5 that a BP target of <130/80 mm Hg may be reasonable, and the European guideline 6 that the first objective of treatment should be to lower BP to <140/ 90 mm Hg and reducing BP to <120/70 mm Hg should be cautious.
The primary end point was MACE, which was a composite of cardiovascular death, myocardial infarction, or stroke. Vital status and the cause of death were retrieved from the mortality records of the National Statistical Office of Korea. Cardiovascular death was defined according to the ICD‐10 codes I00–I99. Myocardial infarction was defined as a hospitalization with the ICD‐10 codes I21–23 as primary or secondary diagnosis. Stroke (hemorrhagic or ischemic) was defined by discharge diagnosis (ICD‐10 codes, I60–64) among patients who had been hospitalized and undergone brain imaging studies such as computed tomography or magnetic resonance imaging. 17 We censored a primary end point using newly occurrence of the ICD‐10 codes for cardiovascular death, myocardial infarction, or stroke. The censoring date was the earliest of the following: date of death, date of primary outcome, or end date of the study period (December 31, 2017).
Statistical Analysis
Data are reported as mean (SD) or median (interquartile range) for continuous variables, and as numbers (percentages) for categorical variables. The incidence rates were estimated using the total number of outcomes during the follow‐up divided by 100 000 person‐years. Cox proportional hazard models were used to evaluate the associations between baseline BP levels and the risk of cardiovascular events. Hazard ratios were adjusted for age, sex, income level, history of smoking, physical activity, alcohol consumption, body mass index, fasting glucose, total cholesterol, diabetes mellitus, and medication of aspirin or statin, and are presented with 95% CIs. We further planned a subgroup analysis of sex, antihypertensive drugs, and age groups that had different clinical outcomes in previous studies, and tested heterogeneity using the interaction term. In the group whose interaction term was statistically significant, subgroup analysis was performed. We also analyzed the association between BP levels and the risk of major cardiovascular events including heart failure in patients without baseline heart failure (ICD‐10 codes, I11.0, I13.0, I13.2, I42, and I50). Statistical analyses were performed using SAS statistical software (version 9.4, SAS Institute, Cary, NC) and R statistical software (version 3.6.1, R Foundation for Statistical Computing, Vienna, Austria).
Results
Baseline Characteristics of the Study Population
A total of 479 359 subjects who were diagnosed with hypertension and who had available blood pressure measurements were identified. The mean age was 58.6±11.7 years and 43.4% were men. The mean systolic and diastolic BPs were 132.7±12.8 and 81.4±8.0 mm Hg, respectively. Mean body mass index was 24.8±3.2 kg/m2. The proportion of treated patients, ie, those who were prescribed anti‐hypertensive medication, was 49.5%. Table 1 shows baseline characteristics of the study population according to BP level. Tables S1 and S2 show baseline characteristics of the study population separately for men and women, respectively.
Table 1.
Baseline Characteristics of the Study Population According to Blood Pressure Level
| Blood Pressure Level (mm Hg) | P Value | |||||
|---|---|---|---|---|---|---|
| <120/<70 | 120–129/70–79 | 130–139/80–89 | 140–149/90–99 | ≥150/≥100 | ||
| No. of patients (%) | 23 756 (4.9) | 117 941 (24.6) | 193 552 (40.3) | 98 593 (20.5) | 45 517 (9.5) | <0.001 |
| Age, y | 54 (45–60) | 58 (50–66) | 59 (51–67) | 60 (52–68) | 64 (54–70) | <0.001 |
| Sex (%) | <0.001 | |||||
| Men | 6232 (26.2) | 45 274 (38.4) | 88 658 (45.8) | 46 719 (47.4) | 21 492 (47.2) | |
| Women | 17 524 (73.8) | 72 667 (61.6) | 104 894 (54.2) | 51 874 (52.6) | 24 025 (52.8) | |
| Blood pressure, mm Hg | ||||||
| Systolic blood pressure | 109.1±6.4 | 121.2±5.6 | 131.9±5.0 | 142.7±4.2 | 156.8±7.9 | <0.001 |
| Diastolic blood pressure | 65.5±3.3 | 74.7±3.3 | 81.9±4.1 | 82.3±5.6 | 92.6±7.9 | <0.001 |
| Household income (%) | <0.001 | |||||
| First (highest) | 8377 (35.3) | 40 920 (34.7) | 66 682 (34.4) | 33 060 (33.5) | 14 308 (31.4) | |
| Second | 5821 (24.5) | 29 078 (24.7) | 48 248 (24.9) | 24 831 (25.2) | 11 275 (24.8) | |
| Third | 4593 (19.3) | 22 631 (19.2) | 36 783 (19.0) | 19 061 (19.3) | 9325 (20.5) | |
| Fourth (lowest) | 4965 (20.9) | 25 312 (21.4) | 41 839 (21.6) | 21 641 (22.0) | 10 609 (23.3) | |
| Smoking (%) | <0.001 | |||||
| Never | 18 570 (78.2) | 85 362 (72.4) | 134 668 (69.6) | 68 669 (69.6) | 32 350 (71.1) | |
| Past | 2147 (9.0) | 15 422 (13.1) | 30 339 (15.7) | 15 548 (15.8) | 6279 (13.8) | |
| Current | 3039 (12.8) | 17 157 (14.5) | 28 545 (14.7) | 14 376 (14.6) | 6888 (15.1) | |
| Physical activity, times/wk (%) | <0.001 | |||||
| 0 | 12 859 (54.1) | 63 908 (54.2) | 102 337 (52.9) | 53 963 (54.7) | 26 583 (58.4) | |
| 1–2 | 3841 (16.2) | 17 254 (14.6) | 28 409 (14.7) | 14 091 (14.3) | 6397 (14.1) | |
| 3–4 | 2852 (12.0) | 13 969 (11.8) | 23 380 (12.1) | 11 278 (11.4) | 4557 (10.0) | |
| 5–6 | 1884 (7.9) | 9860 (8.4) | 16 829 (8.7) | 7989 (8.1) | 3051 (6.7) | |
| 7 | 2320 (9.8) | 12 950 (11.0) | 22 597 (11.6) | 11 272 (11.4) | 4929 (10.8) | |
| Alcohol consumption, times/wk (%) | <0.001 | |||||
| 0 | 17 807 (74.9) | 82 441 (69.9) | 125 907 (65.0) | 62 663 (63.6) | 28 918 (63.5) | |
| <1 | 3014 (12.7) | 14 773 (12.5) | 24 467 (12.6) | 11 465 (11.6) | 4732 (10.4) | |
| 1–2 | 2039 (8.6) | 14 113 (12.0) | 28 861 (14.9) | 15 530 (15.7) | 7060 (15.5) | |
| 3–4 | 486 (2.0) | 3583 (3.0) | 7881 (4.1) | 4693 (4.8) | 2442 (5.3) | |
| ≥5 | 410 (1.7) | 3031 (2.6) | 6436 (3.3) | 4242 (4.3) | 2365 (5.2) | |
| Body mass index, kg/m2 | 23.1±3.0 | 24.4±3.1 | 25.0±3.2 | 25.3±3.3 | 25.3±3.5 | <0.001 |
| Glucose, mg/dL | 98.3±27.1 | 103.0±29.1 | 105.4±29.3 | 107.7±31.3 | 110.5±35.4 | <0.001 |
| Total cholesterol, mg/dL | 191.2±40.7 | 194.9±39.9 | 197.0±40.7 | 198.9±42.3 | 201.6±45.2 | <0.001 |
| Diabetes mellitus (%) | 2892 (12.1) | 14 823 (12.5) | 20 804 (10.7) | 10 097 (10.2) | 4802 (10.5) | <0.001 |
| Aspirin (%) | 4213 (17.7) | 27 713 (23.5) | 50 588 (26.1) | 26 127 (26.5) | 11 802 (25.9) | <0.001 |
| Statin (%) | 3275 (13.7) | 17 234 (14.6) | 25 649 (33.4) | 32 535 (33.0) | 14 520 (31.9) | <0.001 |
| Anti‐hypertensive medication (%) | 6555 (27.5) | 51 304 (43.5) | 100 112 (51.7) | 54 073 (54.8) | 25 548 (56.1) | <0.001 |
Data are expressed as mean±SD, median (interquartile range), or number (percentage).
Relationship Between Blood Pressure Levels and MACE
During 4 294 258 person‐years of follow‐up (median follow‐up, 9 years; interquartile range, 7–11 years), we observed 55 401 MACE (incidence rate, 1290 per 100 000 person‐years): 12 087 cardiovascular deaths, 9324 myocardial infarctions, and 40 774 strokes. MACE occurred in 26 696 men (incidence rate, 1400 per 100 000 person‐years) and 28 705 women (incidence rate, 1201 per 100 000 person‐years). Table 2 details the incidences and adjusted hazard ratio (HR) of MACE according to BP levels. After adjusting all variables, the risk of MACE was the lowest in patients with <120/70 mm Hg and the highest in those with ≥150/≥100 mm Hg. This trend was consistent between men and women (Table S3). Among the components of MACE, the risk of stroke was significantly correlated with BP level, but the risks of cardiovascular death and myocardial infarction were not significantly lower in patients with <130/<80 mm Hg than in the reference group (130–139/80–89 mm Hg) in both men and women (Table 2 and Table S3). Figure 2 shows BP levels and adjusted HR for MACE in all patients with hypertension according to age category. Linear correlations between BP levels and adjusted HR of MACE were observed in all patient groups except men aged ≥70 years. The risk of MACE according to BP increments in all patients with hypertension is shown in Table 3. The incidences and adjusted HR of MACE including heart failure according to BP levels in patients without baseline heart failure (n=461 492) are shown in Tables S4 and S5. Even in the composite events including heart failure, the results were not different. Details of the correlations between BP levels and all‐cause mortality and MACE by sex for different age groups are shown in Tables S6 through S9. Cardiovascular death is significantly increased in the lowest BP level compared with reference BP level in both men and women with ≥70 years, but risk for MACE is not increased significantly.
Table 2.
Incidences of Major Cardiovascular Events According to Blood Pressure Level in All Patients With Hypertension
| Blood Pressure, mm Hg | Events (n) | Person‐Years | Incidence (Events/100 000 Person‐Years) | Adjusted HR (95% CI) |
|---|---|---|---|---|
| Cardiovascular death | ||||
| <120/<70 | 440 | 203 249 | 216 | 1.18 (1.07–1.30) |
| 120–129/70–79 | 2370 | 1 067 813 | 222 | 1.00 (0.95–1.05) |
| 130–139/80–89 | 4220 | 1 820 120 | 232 | 1.00 (reference) |
| 140–149/90–99 | 2907 | 921 915 | 315 | 1.19 (1.14–1.25) |
| ≥150/≥100 | 2150 | 402 612 | 534 | 1.61 (1.52–1.69) |
| MI | ||||
| <120/<70 | 329 | 209 593 | 157 | 0.90 (0.81–1.01) |
| 120–129/70–79 | 2124 | 1 095 879 | 194 | 1.00 (0.95–1.06) |
| 130–139/80–89 | 3688 | 1 871 002 | 197 | 1.00 (reference) |
| 140–149/90–99 | 2058 | 959 597 | 214 | 1.04 (0.99–1.1.0) |
| ≥150/≥100 | 1125 | 432 195 | 260 | 1.18 (1.10–1.26) |
| Stroke | ||||
| <120/<70 | 1095 | 205 177 | 534 | 0.69 (0.65–0.73) |
| 120–129/70–79 | 8156 | 1 059 686 | 770 | 0.88 (0.86–0.91) |
| 130–139/80–89 | 15 929 | 1 794 934 | 887 | 1.00 (reference) |
| 140–149/90–99 | 9855 | 909 679 | 1083 | 1.14 (1.11–1.17) |
| ≥150/≥100 | 5739 | 402 547 | 1426 | 1.31 (1.27–1.35) |
| Cardiovascular death or MI or stroke | ||||
| <120/<70 | 1676 | 202 047 | 830 | 0.79 (0.76–0.84) |
| 120–129/70–79 | 11 362 | 1 042 767 | 1090 | 0.92 (0.90–0.94) |
| 130–139/80–89 | 21 460 | 1 765 485 | 1216 | 1.00 (reference) |
| 140–149/90–99 | 13 112 | 892 521 | 1469 | 1.12 (1.10–1.15) |
| ≥150/≥100 | 7791 | 391 437 | 1990 | 1.32 (1.29–1.36) |
HR was adjusted for age, sex, household income, smoking, physical activity, alcohol consumption, body mass index, glucose, total cholesterol, and medication (aspirin or statin), and antihypertensive medication. HR indicates hazard ratio; and MI, myocardial infarction.
Figure 2. Baseline blood pressure levels and adjusted hazard ratios for major cardiovascular events in all patients with hypertension according to age category.

A, Aged <50 years, (B) aged 50 to 59 years, (C) aged 60 to 69 years, (D) aged ≥70 years. Major cardiovascular events were defined as a composite of cardiovascular death, myocardial infarction, and stroke. BP indicates blood pressure; and HR, hazard ratio.
Table 3.
Risk of Major Cardiovascular Events According to Blood Pressure Increments in All Patients With Hypertension
| Systolic Blood Pressure (mm Hg) | Diastolic Blood Pressure (mm Hg) | |||||
|---|---|---|---|---|---|---|
| Per 20 mm Hg | Per 10 mm Hg | 1‐SD | Per 20 mm Hg | Per 10 mm Hg | 1‐SD | |
| In total population | ||||||
| Adjusted HR (95% CI) | 1.23 (1.21–1.25) | 1.11 (1.10–1.12) | 1.14 (1.13–1.15) | 1.38 (1.35–1.41) | 1.18 (1.16–1.19) | 1.14 (1.13–1.15) |
| In men | ||||||
| Adjusted HR (95% CI) | 1.22 (1.20–1.25) | 1.11 (1.10–1.12) | 1.14 (1.12–1.15) | 1.30 (1.26–1.34) | 1.14 (1.12–1.16) | 1.11 (1.10–1.13) |
| In women | ||||||
| Adjusted HR (95% CI) | 1.21 (1.19–1.23) | 1.10 (1.09–1.11) | 1.13 (1.12–1.15) | 1.39 (1.34–1.43) | 1.18 (1.16–1.20) | 1.14 (1.13–1.15) |
HR was adjusted for age, household income, smoking, physical activity, alcohol consumption, body mass index, glucose, total cholesterol, diabetes mellitus, medication of aspirin or statin, and antihypertensive medication. HR indicates hazard ratio.
Relationship Between Blood Pressure Levels and MACE in Patients Treated for Hypertension
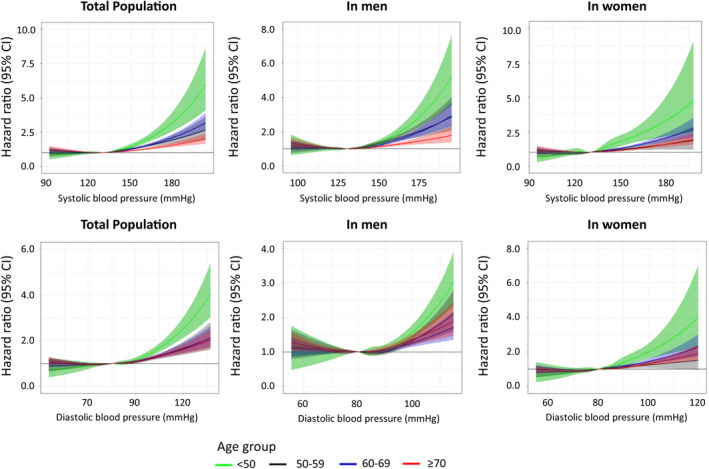
Table 4 shows the incidence of MACE according to BP levels among patients treated for hypertension. In multivariable analysis, the incidence of MACE increased significantly higher at ≥140/≥90 mm Hg than at the reference BP level (130–139/80–89 mm Hg), but it was not significantly lower at lower BP levels (<130/<80 mm Hg). This result was consistent between men and women (Table S10). Among the components of MACE, the risk of stroke was significantly decreased at BP levels lower than the reference BP level. However, low BP <130/80 mm Hg was not beneficial for the prevention of cardiovascular death or myocardial infarction. Figure 3 shows the relationship between BP levels and adjusted HR for MACE in treated hypertensive patients of different age categories. Significant risk reduction of MACE at low BP levels (<130/<80 mm Hg) was observed only in some of the age categories. Rather, patients with BP <120/<70 mm Hg had higher risk of all‐cause or cardiovascular death than those with the reference BP level in all age categories (Tables S6 through S9). This trend was also consistent when analyzing the patient group excluding heart failure (Table S5). The restricted cubic spline curves for the risk of MACE according to systolic and diastolic BP levels are shown in Figure 4.
Table 4.
Incidences of Major Cardiovascular Events According to Blood Pressure Level in Patients Treated for Hypertension
| Blood Pressure (mm Hg) | Events (n) | Person‐Years | Incidence (Events/100 000 Person‐Years) | Adjusted HR (95% CI) |
|---|---|---|---|---|
| Cardiovascular death | ||||
| <120/<70 | 251 | 23 191 | 1082 | 1.70 (1.49–1.94) |
| 120–129/70–79 | 1225 | 450 400 | 272 | 1.09 (1.02–1.17) |
| 130–139/80–89 | 2183 | 910 024 | 240 | 1.00 (reference) |
| 140–149/90–99 | 1545 | 486 613 | 318 | 1.19 (1.11–1.27) |
| ≥150/≥100 | 1139 | 219 428 | 519 | 1.57 (1.46–1.69) |
| MI | ||||
| <120/<70 | 134 | 55 833 | 240 | 1.08 (0.90–1.28) |
| 120–129/70–79 | 1034 | 463 106 | 223 | 1.08 (1.00–1.16) |
| 130–139/80–89 | 1872 | 935 410 | 200 | 1.00 (reference) |
| 140–149/90–99 | 1043 | 506 155 | 206 | 1.00 (0.93–1.08) |
| ≥150/≥100 | 623 | 234 314 | 266 | 1.20 (1.09–1.31) |
| Stroke | ||||
| <120/<70 | 438 | 54 152 | 809 | 0.80 (0.73–0.89) |
| 120–129/70–79 | 3784 | 447 167 | 846 | 0.90 (0.87–0.94) |
| 130–139/80–89 | 8091 | 898 319 | 901 | 1.00 (reference) |
| 140–149/90–99 | 5127 | 481 293 | 1065 | 1.12 (1.08–1.15) |
| ≥150/≥100 | 3028 | 219 361 | 1380 | 1.28 (1.22–1.33) |
| Cardiovascular death or MI or stroke | ||||
| <120/<70 | 728 | 52 660 | 1382 | 0.99 (0.92–1.07) |
| 120–129/70–79 | 5418 | 438 920 | 1234 | 0.96 (0.93–0.99) |
| 130–139/80–89 | 10 943 | 883 940 | 1238 | 1.00 (reference) |
| 140–149/90–99 | 6843 | 472 686 | 1448 | 1.10 (1.07–1.13) |
| ≥150/≥100 | 4151 | 213 621 | 1943 | 1.30 (1.25–1.35) |
Hazard ratio was adjusted for age, household income, smoking, physical activity, alcohol consumption, body mass index, glucose, total cholesterol, and medication (aspirin or statin). HR indicates hazard ratio; and MI, myocardial infarction.
Figure 3. Baseline blood pressure levels and adjusted hazard ratios for major cardiovascular events in patients treated for hypertension according to age category.

A, Aged <50 years, (B) aged 50 to 59 years, (C) aged 60 to 69 years, (D) aged ≥70 years. Major cardiovascular events were defined as a composite of cardiovascular death, myocardial infarction, and stroke. BP indicates blood pressure; and HR, hazard ratio.
Figure 4. The relationship between baseline systolic and diastolic blood pressures and major cardiovascular events in patients treated for hypertension.
Sensitivity Analyses in Patients Without Taking Antihypertensive Medications and in Those Without Diabetes Mellitus
We further analyzed whether the relationship between blood pressure levels and major cardiovascular events had consistent results in patients who did not take antihypertensive medications (Table S11) or who did not have diabetes mellitus (Table S12). Even in patients without diabetes mellitus, the higher the blood pressure than the reference BP (130–139/80–89 mm Hg), the higher the risk of MACE. However, patients with BP <120/70 mm Hg had higher risk of all‐cause or cardiovascular death than those with the reference BP.
Discussion
In this nationwide cohort study, we have revealed that (1) elevated BP is a strong predictor of future MACE including cardiovascular death, myocardial infarction, or stroke; (2) BP level is significantly correlated with the risk of MACE, especially the incidence of stroke, in all patients with hypertension; however, (3) there is no further benefit of low BP <130/80 mm Hg in comparison with <140/90 mm Hg for MACE in patients treated with antihypertensive medication; and (4) low BP <120/70 mm Hg was associated with a higher risk of all‐cause or cardiovascular death in all age groups.
Although current guidelines recommend a target BP level of <130/80 mm Hg, there is no consensus on the optimal BP target in the treatment of hypertension. SPRINT trial, which was relevant to this issue, showed that intensive treatment (systolic BP target of <120 mm Hg) was associated with a 25% reduction in MACE and a 27% reduction in all‐cause mortality in comparison with conventional treatment (systolic BP target of <140 mm Hg). 4 However, this trial relied on unattended automatic office BP measurements, which had not been used in any previous randomized trials. 18 Such measurements are known to result in lower BP values than conventional office BP measurements, because of the absence of the white‐coat effect. 19 , 20 Thus, it has been suggested that the BP values (121.5 mm Hg in intensive‐treatment group versus 134.6 mm Hg in standard‐treatment group) reported in SPRINT may correspond to conventional office systolic BP in the 130 to 140 and 140 to 150 mm Hg ranges in the intensive versus conventional BP‐lowering groups, respectively. 6
In this nationwide cohort, all BP measurement methods could not be determined. However, most of the BP measurements must have been performed by an attending nurse or physician. Despite this, the benefit of low BP <130/80 mm Hg for MACE was found in all patients with hypertension except men aged ≥70 years, but not in patients treated for hypertension. These discordant results can be explained in several ways. First, in our study, patients with hypertension without antihypertensive medication were younger and had lower BP values, lower body mass index, lower fasting glucose, and lower prevalence of diabetes mellitus than treated patients. Second, because patients not medicated for hypertension constitute a large proportion of low‐BP groups, these populations may implement lifestyle intervention well. On the other hand, because patients medically treated for hypertension are much more represented in higher‐BP groups, these patients may have advanced vascular pathologies such as arterial stiffness and large pulse pressure values. Third, a few patients not medicated for hypertension might be misdiagnosed with hypertension because of the white‐coat effect. Therefore, after patients not medicated for hypertension were excluded, the number of treated patients in low‐BP groups was lower than in other groups; thus, the benefit of lowering BP for future cardiovascular events might have disappeared. In addition, our results support “the lower, the better” in BP control at an early hypertension stage and/or in young patients with hypertension. This result is consistent with previous Korean analyses, which showed that normal BP range (<120/<80 mm Hg) is associated with the lowest cardiovascular risk in comparison with the upper BP ranges in the general population 21 , 22 and in young patients with hypertension. 23 , 24 In young patients with hypertension and at an early stage of the disease, lowering BP below the normal BP level should be beneficial regardless of medication or lifestyle modification.
In our study, no benefit of low BP <130/80 mm Hg for prevention of MACE was observed in treated patients with hypertension. Moreover, low BP <120/70 mm Hg was associated with increased risk of all‐cause or cardiovascular death in all age categories. The lower safety boundary of BP control has not been decided yet in high‐cardiovascular‐risk or elderly patients. Previous studies on high‐risk patients reported that lowering systolic BP to <130 mm Hg significantly reduces the risk of cardiovascular disease, 9 , 10 but reduction of systolic BP to <120 mm Hg or diastolic BP to <70 mm Hg is associated with an increase in the incidence of cardiovascular events. 12 A Korean study using NHIS data showed a J‐curve pattern between BP levels and ischemic heart disease or acute myocardial infarction in patients aged 70 to 80 years without known hypertension. 25 Furthermore, lower baseline diastolic BP is reportedly associated with increased risk of cardiovascular events. 26 , 27 Currently, American and European guidelines recommend that the target BP should be 130/80 mm Hg, but the target systolic BP should not be <120 mm Hg in elderly patients (>65 years). 5 , 6 Our results support these recommendations. Thus, it is recommended to should be careful when performing intensive BP control in elderly patients.
This study has several limitations. First, it was a retrospective cohort study, and thus had the inherent limitations of this type of analysis. However, the use of the national registration data ensured that the treatment status of the study population was known, no cardiovascular outcomes were missed, and the chance of attrition bias was low. Seconds, since this is an observational study, it is inevitable to be criticized for whether the low BP at a single point reflects the strict controlled BP. It was also impossible to exclude all other systemic conditions at single point. Especially, we could not exclude the reverse causality between all‐cause mortality, to some extent cardiovascular death, and low BP levels. Therefore, it cannot be concluded by generalizing the target BP in patients treated for hypertension based on the results of our study. Third, it was not possible to determine exactly what are the events that drive the increase in CV death in our study. Indeed, there was no signal of increase in MI or stroke, indeed for the latter it was beneficial. However, our study is sufficient to support that low BP below 120/70 mm Hg might not at least be beneficial in patients treated with antihypertensive medication. Fourth, this study population was of homogeneous Korean ethnicity, and hypertensive patients with the past MACE were excluded, so caution is required to generalize the findings of this study to other ethnic groups or high‐risk populations. Fifth, we used only baseline BP, but did not incorporate the follow‐up BP data in our analysis. Thus, we evaluated the longitudinal effect of baseline BP levels, but could not evaluate the effect of follow‐up BP. Sixth, prescription of anti‐hypertensive medication was evaluated at baseline time. However, we did not evaluate continuous prescription of medication during follow‐up. Thus, we could not incorporate the effect of medication compliance in our analysis. In addition, we could not evaluate treatment pattern or dose of medication, which might influence BP levels. Seventh, we extracted patients with hypertension between 2002 and 2012. At this period, hypertension was defined as ≥140 and/or ≥90 mm Hg according to The Sixth and Seventh Reports of the Joint National Committee on Prevention, Detection, Evaluation, and Treatment of High Blood Pressure. 28 , 29 So, there is inconsistency of hypertension definition between this study and current American guidelines. Finally, even subgroup analysis of patients without heart failure had consistent results, but we could not exclude all the patients with any cardiovascular disease like angina, peripheral arterial disease or patients with history of revascularization. Therefore, it cannot be concluded by generalizing the target BP in patients treated for hypertension based on the results of our study. However, our study was worthwhile because that it was a nationwide study with a large sample size and long‐term follow‐up periods and we had consistent results that low BP <120/70 mm Hg might not at least be beneficial, even when we reanalyzed the subgroup without heart failure. Based on our findings, well‐designed studies related to the BP goal in patients treated for hypertension are needed.
Conclusions
Elevated BP is a strong predictor for future MACE in all Korean patients with hypertension. However, in patients treated with antihypertensive medication, low BP <120/70 mm Hg might not at least be beneficial for the prevention of MACE.
Sources of Funding
This study was supported by the Korean Society of Hypertension.
Disclosures
The authors have no conflicts of interest relevant to the manuscript to disclose.
Supporting information
Tables S1–S12
Figure S1
Acknowledgments
National Health Information Database was provided by the NHIS of Korea. The authors thank the NHIS for cooperation.
(J Am Heart Assoc. 2021;10:e017890. DOI: 10.1161/JAHA.120.017890.)
For Sources of Funding and Disclosures, see page 13.
Contributor Information
Wook Bum Pyun, Email: pwb423@ewha.ac.kr.
Ki‐Chul Sung, Email: kcmd.sung@samsung.com.
References
- 1. Collaborators GBDRF . Global, regional, and national comparative risk assessment of 84 behavioural, environmental and occupational, and metabolic risks or clusters of risks, 1990–2016: a systematic analysis for the global burden of disease study 2016. Lancet. 2017;390:1345–1422. DOI: 10.1016/S0140-6736(17)32366-8. [DOI] [PMC free article] [PubMed] [Google Scholar]
- 2. Mancia G, Fagard R, Narkiewicz K, Redon J, Zanchetti A, Bohm M, Christiaens T, Cifkova R, De Backer G, Dominiczak A, et al. 2013 ESH/ESC guidelines for the management of arterial hypertension: the Task Force for the management of arterial hypertension of the European Society of Hypertension (ESH) and of the European Society of Cardiology (ESC). Eur Heart J. 2013;34:2159–2219. DOI: 10.1093/eurheartj/eht151. [DOI] [PubMed] [Google Scholar]
- 3. James PA, Oparil S, Carter BL, Cushman WC, Dennison‐Himmelfarb C, Handler J, Lackland DT, LeFevre ML, MacKenzie TD, Ogedegbe O, et al. 2014 evidence‐based guideline for the management of high blood pressure in adults: report from the panel members appointed to the Eighth Joint National Committee (JNC 8). JAMA. 2014;311:507–520. DOI: 10.1001/jama.2013.284427. [DOI] [PubMed] [Google Scholar]
- 4. Group SR , Wright JT Jr, Williamson JD, Whelton PK, Snyder JK, Sink KM, Rocco MV, Reboussin DM, Rahman M, Oparil S, Lewis CE, et al. A randomized trial of intensive versus standard blood‐pressure control. N Engl J Med. 2015;373:2103–2116. [DOI] [PMC free article] [PubMed] [Google Scholar]
- 5. Whelton PK, Carey RM, Aronow WS, Casey DE, Collins KJ, Dennison Himmelfarb C, DePalma SM, Gidding S, Jamerson KA, Jones DW, et al. 2017 ACC/AHA/AAPA/ABC/ACPM/AGS/APHA/ASH/ASPC/NMA/PCNA guideline for the prevention, detection, evaluation, and management of high blood pressure in adults: a report of the American College of Cardiology/American Heart Association Task Force on clinical practice guidelines. Circulation. 2018;138:e484–e594. DOI: 10.1161/CIR.0000000000000596. [DOI] [PubMed] [Google Scholar]
- 6. Williams B, Mancia G, Spiering W, Agabiti Rosei E, Azizi M, Burnier M, Clement DL, Coca A, de Simone G, Dominiczak A, et al. 2018 ESC/ESH guidelines for the management of arterial hypertension. Eur Heart J. 2018;39:3021–3104. DOI: 10.1093/eurheartj/ehy339. [DOI] [PubMed] [Google Scholar]
- 7. Lv J, Ehteshami P, Sarnak MJ, Tighiouart H, Jun M, Ninomiya T, Foote C, Rodgers A, Zhang H, Wang H, et al. Effects of intensive blood pressure lowering on the progression of chronic kidney disease: a systematic review and meta‐analysis. CMAJ. 2013;185:949–957. DOI: 10.1503/cmaj.121468. [DOI] [PMC free article] [PubMed] [Google Scholar]
- 8. Brunstrom M, Carlberg B. Effect of antihypertensive treatment at different blood pressure levels in patients with diabetes mellitus: systematic review and meta‐analyses. BMJ. 2016;352:i717. DOI: 10.1136/bmj.i717. [DOI] [PMC free article] [PubMed] [Google Scholar]
- 9. Ettehad D, Emdin CA, Kiran A, Anderson SG, Callender T, Emberson J, Chalmers J, Rodgers A, Rahimi K. Blood pressure lowering for prevention of cardiovascular disease and death: a systematic review and meta‐analysis. Lancet. 2016;387:957–967. DOI: 10.1016/S0140-6736(15)01225-8. [DOI] [PubMed] [Google Scholar]
- 10. Thomopoulos C, Parati G, Zanchetti A. Effects of blood pressure lowering on outcome incidence in hypertension: 7. Effects of more vs. less intensive blood pressure lowering and different achieved blood pressure levels—updated overview and meta‐analyses of randomized trials. J Hypertens. 2016;34:613–622. DOI: 10.1097/HJH.0000000000000881. [DOI] [PubMed] [Google Scholar]
- 11. Lawes CM, Rodgers A, Bennett DA, Parag V, Suh I, Ueshima H, MacMahon S; Asia Pacific Cohort Studies C . Blood pressure and cardiovascular disease in the Asia Pacific region. J Hypertens. 2003;21:707–716. DOI: 10.1097/00004872-200304000-00013. [DOI] [PubMed] [Google Scholar]
- 12. Böhm M, Schumacher H, Teo KK, Lonn EM, Mahfoud F, Mann JFE, Mancia G, Redon J, Schmieder RE, Sliwa K, et al. Achieved blood pressure and cardiovascular outcomes in high‐risk patients: results from ONTARGET and TRANSCEND trials. Lancet. 2017;389:2226–2237. DOI: 10.1016/S0140-6736(17)30754-7. [DOI] [PubMed] [Google Scholar]
- 13. Kjeldsen SE, Berge E, Bangalore S, Messerli FH, Mancia G, Holzhauer B, Hua TA, Zappe D, Zanchetti A, Weber MA, et al. No evidence for a J‐shaped curve in treated hypertensive patients with increased cardiovascular risk: the VALUE trial. Blood Press. 2016;25:83–92. DOI: 10.3109/08037051.2015.1106750. [DOI] [PubMed] [Google Scholar]
- 14. Mancia G, Kjeldsen SE, Zappe DH, Holzhauer B, Hua TA, Zanchetti A, Julius S, Weber MA. Cardiovascular outcomes at different on‐treatment blood pressures in the hypertensive patients of the value trial. Eur Heart J. 2016;37:955–964. DOI: 10.1093/eurheartj/ehv633. [DOI] [PubMed] [Google Scholar]
- 15. Cheol Seong S, Kim YY, Khang YH, Heon Park J, Kang HJ, Lee H, Do CH, Song JS, Hyon Bang J, Ha S, et al. Data resource profile: the national health information database of the National Health Insurance Service in South Korea. Int J Epidemiol. 2017;46:799–800. [DOI] [PMC free article] [PubMed] [Google Scholar]
- 16. Seong SC, Kim Y‐Y, Park SK, Khang YH, Kim HC, Park JH, Kang H‐J, Do C‐H, Song J‐S, Lee E‐J, et al. Cohort profile: the national health insurance service‐national health screening cohort (NHIS‐HEALS) in Korea. BMJ Open. 2017;7:e016640. DOI: 10.1136/bmjopen-2017-016640. [DOI] [PMC free article] [PubMed] [Google Scholar]
- 17. Park TH, Choi JC. Validation of stroke and thrombolytic therapy in Korean National Health Insurance claim data. J Clin Neurol. 2016;12:42–48. DOI: 10.3988/jcn.2016.12.1.42. [DOI] [PMC free article] [PubMed] [Google Scholar]
- 18. Kjeldsen SE, Lund‐Johansen P, Nilsson PM, Mancia G. Unattended blood pressure measurements in the systolic blood pressure intervention trial: implications for entry and achieved blood pressure values compared with other trials. Hypertension. 2016;67:808–812. DOI: 10.1161/HYPERTENSIONAHA.116.07257. [DOI] [PubMed] [Google Scholar]
- 19. Filipovsky J, Seidlerova J, Kratochvil Z, Karnosova P, Hronova M, Mayer O Jr. Automated compared to manual office blood pressure and to home blood pressure in hypertensive patients. Blood Press. 2016;25:228–234. DOI: 10.3109/08037051.2015.1134086. [DOI] [PubMed] [Google Scholar]
- 20. Parati G, Stergiou G, O’Brien E, Asmar R, Beilin L, Bilo G, Clement D, de la Sierra A, de Leeuw P, Dolan E, et al. European society of hypertension practice guidelines for ambulatory blood pressure monitoring. J Hypertens. 2014;32:1359–1366. DOI: 10.1097/HJH.0000000000000221. [DOI] [PubMed] [Google Scholar]
- 21. Choi YJ, Kim SH, Kang SH, Yoon CH, Lee HY, Youn TJ, Chae IH, Kim CH. Reconsidering the cut‐off diastolic blood pressure for predicting cardiovascular events: a nationwide population‐based study from Korea. Eur Heart J. 2019;40:724–731. DOI: 10.1093/eurheartj/ehy801. [DOI] [PubMed] [Google Scholar]
- 22. Son JS, Choi S, Kim K, Kim SM, Choi D, Lee G, Jeong S‐M, Park SY, Kim Y‐Y, Yun J‐M, et al. Association of blood pressure classification in Korean young adults according to the 2017 American College of Cardiology/American Heart Association guidelines with subsequent cardiovascular disease events. JAMA. 2018;320:1783–1792. DOI: 10.1001/jama.2018.16501. [DOI] [PMC free article] [PubMed] [Google Scholar]
- 23. Kwon CH, Kang J, Cho A, Chang Y, Ryu S, Sung KC. Optimal target blood pressure and risk of cardiovascular disease in low‐risk younger hypertensive patients. Am J Hypertens. 2019;32:833–841. DOI: 10.1093/ajh/hpz067. [DOI] [PubMed] [Google Scholar]
- 24. Kim S, Chang Y, Kang J, Cho A, Cho J, Hong YS, Zhao D, Ahn J, Shin H, Guallar E, et al. Relationship of the blood pressure categories, as defined by the ACC/AHA 2017 blood pressure guidelines, and the risk of development of cardiovascular disease in low‐risk young adults: insights from a retrospective cohort of young adults. J Am Heart Assoc. 2019;8:e011946. DOI: 10.1161/JAHA.119.011946. [DOI] [PMC free article] [PubMed] [Google Scholar]
- 25. Jung MH, Yi SW, An SJ, Yi JJ. Age‐specific associations between systolic blood pressure and cardiovascular mortality. Heart. 2019;105:1070–1077. DOI: 10.1136/heartjnl-2019-314697. [DOI] [PubMed] [Google Scholar]
- 26. Beddhu S, Chertow GM, Cheung AK, Cushman WC, Rahman M, Greene T, Wei G, Campbell RC, Conroy M, Freedman BI, et al. Influence of baseline diastolic blood pressure on effects of intensive compared with standard blood pressure control. Circulation. 2018;137:134–143. DOI: 10.1161/CIRCULATIONAHA.117.030848. [DOI] [PMC free article] [PubMed] [Google Scholar]
- 27. Hansson L, Zanchetti A, Carruthers SG, Dahlof B, Elmfeldt D, Julius S, Menard J, Rahn KH, Wedel H, Westerling S. Effects of intensive blood‐pressure lowering and low‐dose aspirin in patients with hypertension: Principal results of the hypertension optimal treatment (HOT) randomised trial. Hot Study Group. Lancet. 1998;351:1755–1762. DOI: 10.1016/S0140-6736(98)04311-6. [DOI] [PubMed] [Google Scholar]
- 28. The sixth report of the joint national committee on prevention, detection, evaluation, and treatment of high blood pressure. Arch Intern Med. 1997;157:2413–2446. [DOI] [PubMed] [Google Scholar]
- 29. Chobanian AV, Bakris GL, Black HR, Cushman WC, Green LA, Izzo JL Jr, Jones DW, Materson BJ, Oparil S, Wright JT Jr, et al. Seventh report of the Joint National Committee on prevention, detection, evaluation, and treatment of high blood pressure: the JNC 7 report. Hypertension. 2003;42:1206–1252. DOI: 10.1161/01.HYP.0000107251.49515.c2. [DOI] [PubMed] [Google Scholar]
Associated Data
This section collects any data citations, data availability statements, or supplementary materials included in this article.
Supplementary Materials
Tables S1–S12
Figure S1