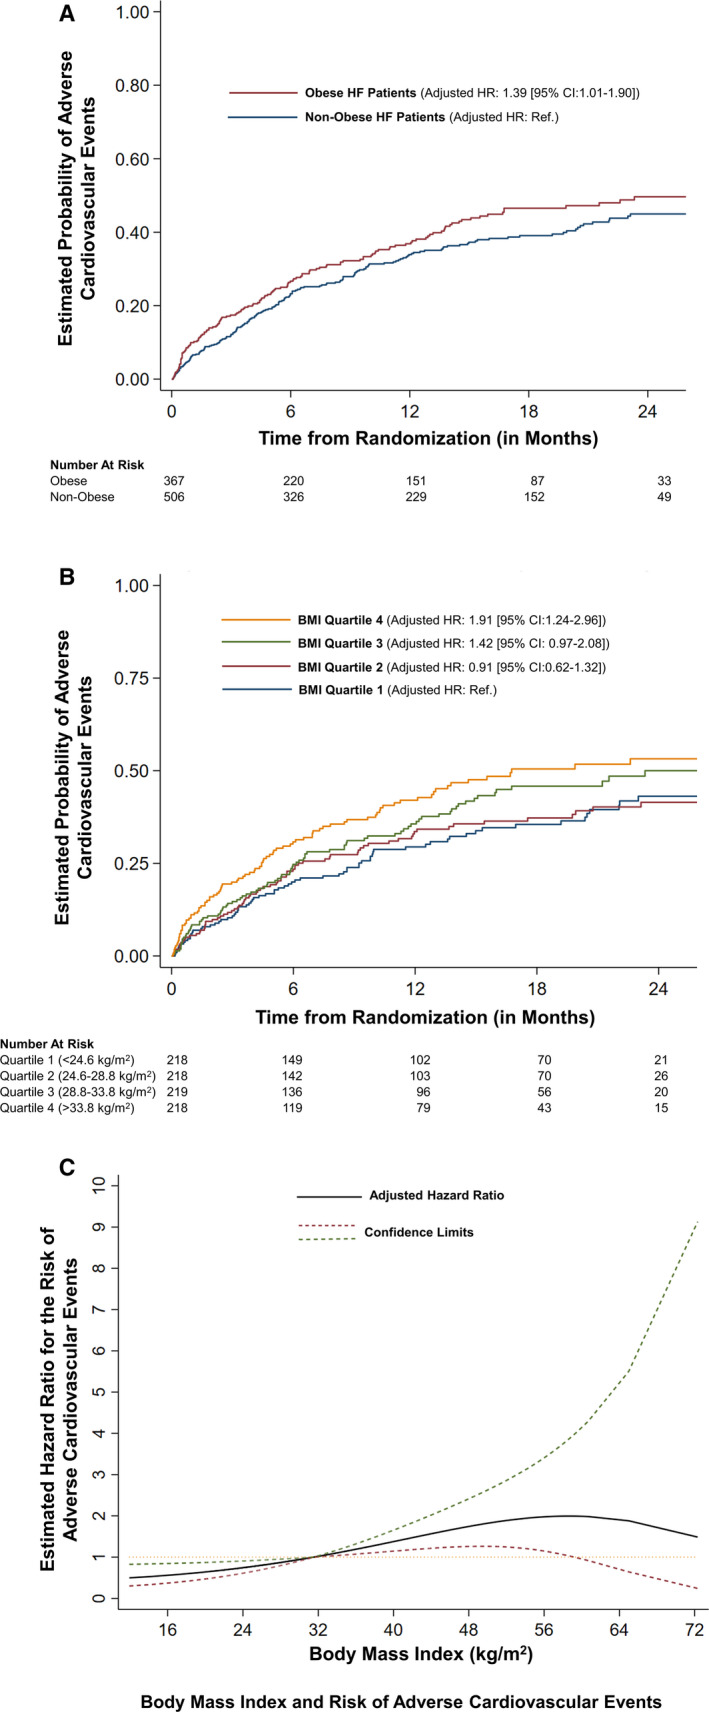
Figure 2. Obesity and risk of adverse cardiovascular events.

The figure shows the risk of adverse cardiovascular events based on baseline body mass index (BMI), stratified on obesity status (A) and quartiles (B). C, The relationship of the risk of adverse cardiovascular events with baseline BMI. Adjusted for age, sex, race, blood urea nitrogen, left ventricular ejection fraction, diabetes mellitus, guideline‐directed medical therapy score, systolic and diastolic blood pressure, log‐transformed NT‐proBNP (N‐terminal pro‐B‐type natriuretic peptide) (time varying), New York Heart Association class, ischemic heart disease history, history of cancer in past 5 years, sleep apnea, and treatment arm. HF indicates heart failure; HR, hazard ratio; and Ref., reference.
