
Figure 2. ITGAM deficiency attenuates the development of experimental AAA, vascular structural injury, and the inflammatory response.
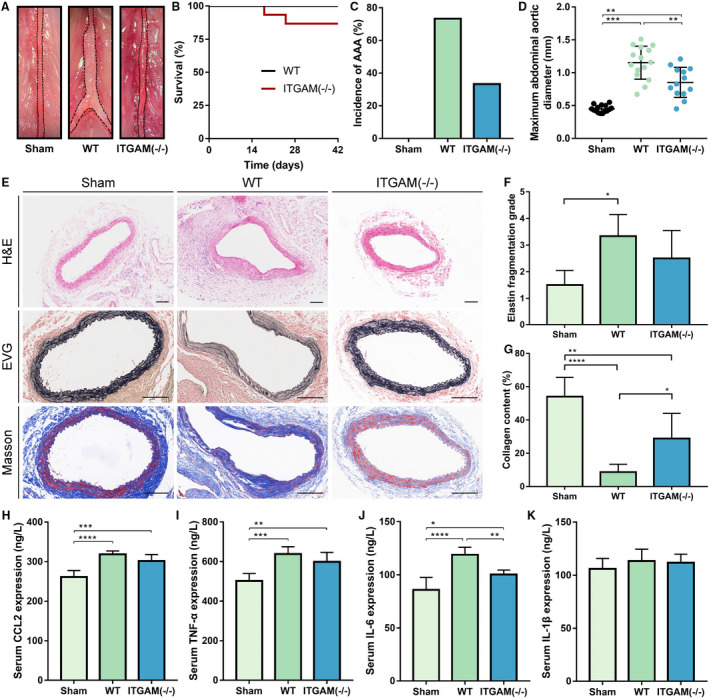
A, Representative photographs of the infrarenal abdominal aortas in saline‐ or CaCl2‐treated WT and ITGAM(‐/‐) male mice. The black dotted lines indicate the edge of abdominal aortas. B, Kaplan–Meier survival curves of WT (n=15) and ITGAM(‐/‐) mice (n=15). No significant difference was found regarding the survival rate. C, Incidence of AAA formation in WT and ITGAM(‐/‐) mice in response to CaCl2. D, Maximal abdominal aortic diameter of WT (n=15) and ITGAM(‐/‐) mice (n=13) 6 weeks after being exposed to CaCl2 and the sham‐treated mice (n=15). The data represent the mean±SEM. **P<0.01, ***P<0.001. E, Representative H&E, EVG, and Masson trichrome staining of the abdominal aortic tissues from the sham‐treated, WT, and ITGAM(‐/‐) mice. Scale bar=100 μm. F and G, Quantification of elastin fragmentation and collagen deposition in the experimental groups (n=6), *P<0.05, **P<0.01, ****P<0.0001. H through K, Serum CCL2, TNF‐α, IL‐6, and IL‐1β levels in the experimental groups (n=6 for each group) detected by ELISA, *P<0.05, **P<0.01, ***P<0.001, ****P<0.0001. AAA indicates abdominal aortic aneurysm; EVG, Elastica Van Gieson; H&E, hematoxylin and eosin; ITGAM, integrin subunit alpha M; and WT, wild‐type.