
Figure 2. Mortality and cardiovascular events rates for 16 groups, stratified primarily by BP and then by income for each BP level.
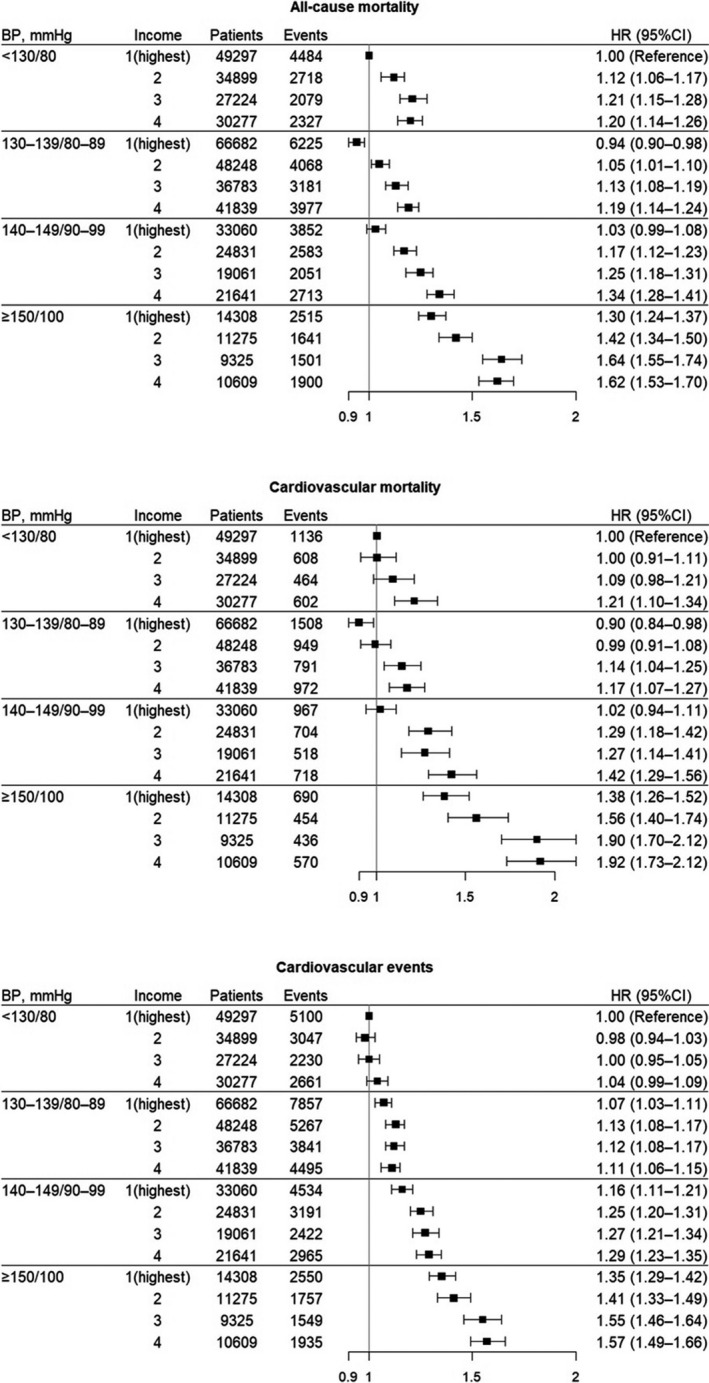
A Cox proportional hazard regression model adjusted for age, sex, BP, body mass index, smoking status, alcohol consumption, physical activity, fasting glucose, total cholesterol, and aspirin or statin use. The x axis refers to HR (95% CI), and HR itself (not log [HR]) was plotted. BP indicates blood pressure; and HR, hazard ratio.