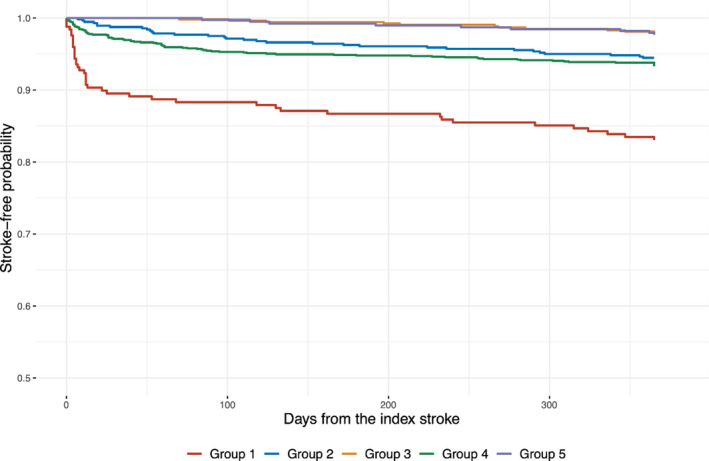
Figure 1. Stroke‐free survival by the quintile groups of TI score.

Hazard ratios and 95% CIs were calculated using frailty models that considered the clustering effect of the treating hospitals and adjusted for age, sex, baseline National Institutes of Health Stroke Scale score, stroke mechanism, hypertension, diabetes mellitus, dyslipidemia, atrial fibrillation, and prestroke disability. TI indicates treatment intensification.
