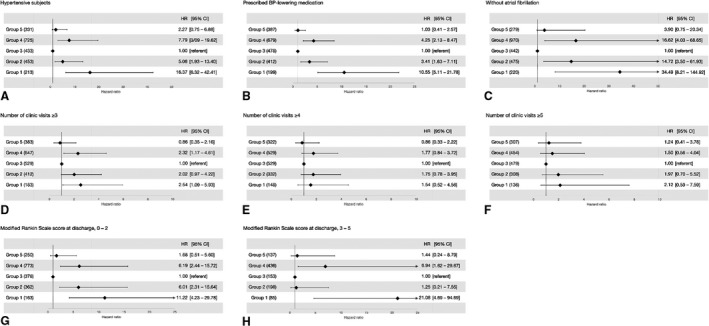
Figure 2. Sensitivity analyses.

The frailty models adjusted for the clustering effect and for the relevant covariates were repeated with subsets of patients: subjects with hypertension (A), subjects who had prescribed BP‐lowering medication (B), subjects without atrial fibrillation (C), those who returned to the outpatient clinic ≥3 (D), ≥4 (E) and ≥5 (F) times, and those who had mRS score 0 to 2 (G) and 3 to 5 (H) at the time of discharge. BP indicates blood pressure; HR, hazard ratio; and mRS, modified Rankin Scale.
