
Figure 2. E2‐induced mitochondrial autophagy.
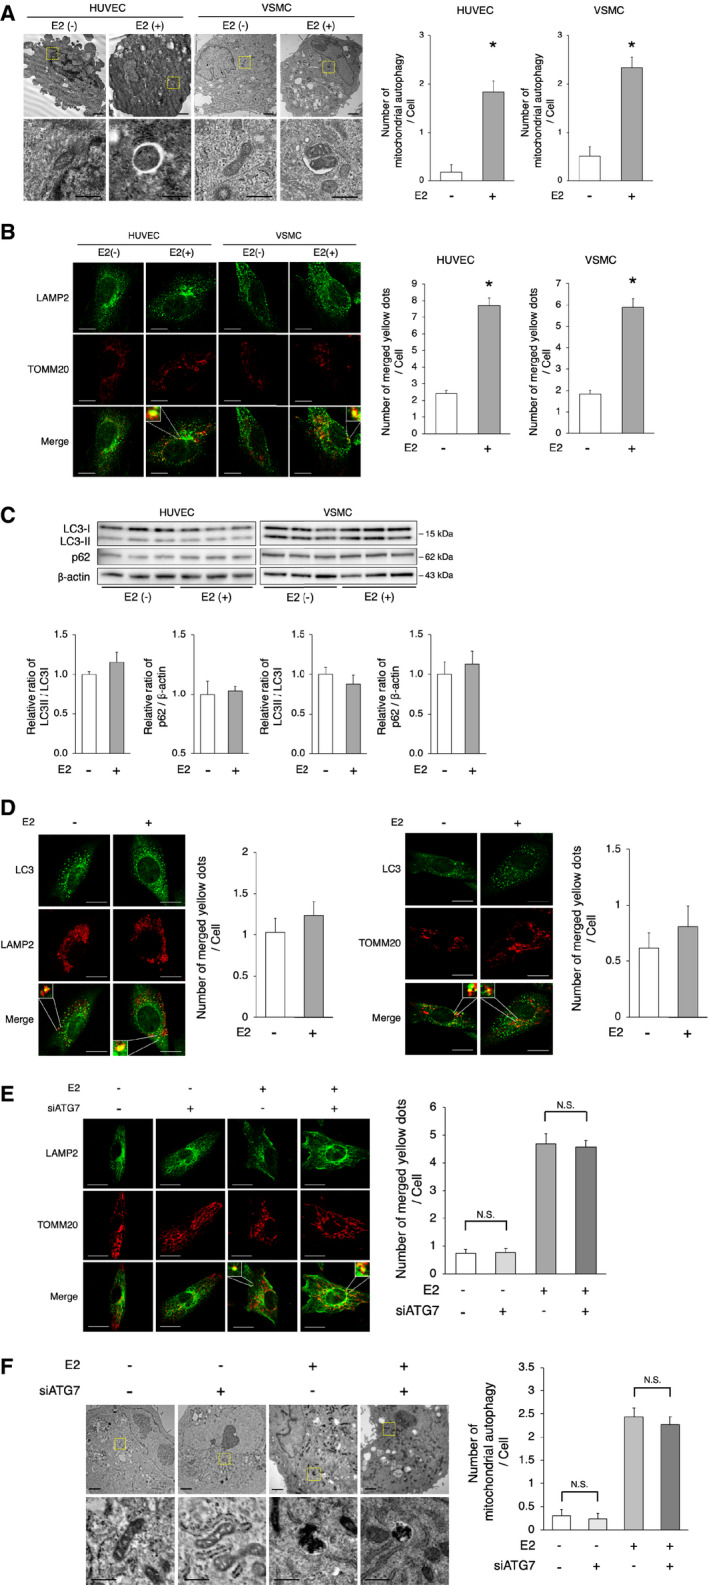
A, Electron microscopy analyses of mitochondrial autophagy in HUVECs and VSMCs with or without E2 (upper panel, scale bar=1 μm). Enlarged images of the areas delineated by the dashed rectangles are shown below (scale bar=500 nm). The cells of each group were randomly selected from 3 independent experiments, and the number of mitochondria engulfed by autophagosomes was counted. The number of autophagosomes/autolysosomes engulfing mitochondria per cell was higher in E2‐treated cells. *P<0.01 vs E2(−). B, Representative images of LAMP2 (green) and TOMM20 (red) immunohistochemistry in HUVECs and VSMCs with or without E2. Thirty cells were evaluated per group, in the context of 3 independent experiments. The number of merged yellow signals was higher in E2‐treated cells. Scale bar=10 μm. *P<0.01 vs E2(−). C, Immunoblots and quantitative analysis results of LC3 and p62 are shown. No difference in LC3 and p62 was noted between the 2 groups (n=3 per group). D, Left panel: Representative images of LC3 (green) and LAMP2 (red) immunohistochemistry in VSMCs with or without E2. Thirty cells were evaluated per group, in the context of 3 independent experiments. The number of merged yellow signals was not different between the 2 groups. Scale bar=10 μm. Right panel: Representative images of LC3 (green) and TOMM20 (red) immunohistochemistry in VSMCs with or without E2. Thirty cells were evaluated per group, in the context of 3 independent experiments. The number of merged yellow signals was not different between the 2 groups. Scale bar=10 μm. E, Representative images of LAMP2 (green) and TOMM20 (red) immunohistochemistry in E2 or vehicle‐treated VSMCs transfected with siATG7 or siControl. Thirty cells were evaluated per group, in the context of 3 independent experiments. The number of merged yellow signals was not different in VSMCs transfected with siATG7 and siControl, either treated with vehicle or E2, respectively. N. S.; not significant. Statistical analysis was performed using 2‐way analysis of variance. Scale bar=10 μm. F, Electron microscopy analyses of mitochondrial autophagy in E2 or vehicle‐treated VSMCs transfected with siATG7 or siControl (upper panel, scale bar, 1 μm). Enlarged images of the areas delineated by the dashed rectangles are shown below (scale bar=500 nm). The cells of each group were randomly selected from 3 independent experiments, and the number of mitochondria engulfed by autophagosomes was counted. The number of autophagosomes/autolysosomes engulfing mitochondria per cell was not different in VSMCs transfected with siATG7 and siControl, either treated with vehicle or E2, respectively. N. S.; not significant. Statistical analysis was performed using 2‐way analysis of variance. All data are shown as the mean±SEM. E2 indicates 17β‐estradiol; HUVECs, human umbilical vein endothelial cells; LAMP2, lysosome‐associated membrane protein 2; LC3, light chain 3; TOMM20, translocase of outer mitochondrial membrane 20; and VSMCs, vascular smooth muscle cells.