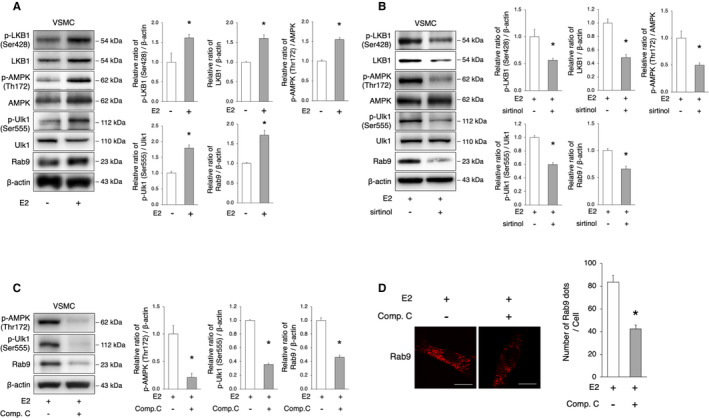
Figure 5. The SIRT1/LKB1/AMPK/Ulk1 axis is involved in the induction of alternative autophagy.

A, Representative immunoblots and quantitative analysis of LKB1, AMPK, Ulk1, and Rab9 in VSMCs with or without E2 treatment. E2 treatment activated LKB1, AMPK, Ulk1, and Rab9. *P<0.05 vs E2(−) (n=3 per group). B, Representative immunoblots and quantitative analysis of LKB1, AMPK, Ulk1, and Rab9 in E2‐treated VSMCs with or without sirtinol. The administration of sirtinol attenuated the activation of LKB1, AMPK, Ulk1, and Rab9 by E2. *P<0.05 vs E2(+) (n=3 per group). C, Representative immunoblots and quantitative analysis of AMPK, Ulk1, and Rab9 in E2‐treated VSMC with or without Compound C (10 μmol/L). The administration of Compound C attenuated the activation of AMPK, Ulk1, and Rab9 by E2. *P<0.05 vs E2(+) (n=3 per group). D, Representative images of Rab9 (red) immunohistochemistry in E2‐treated VSMCs with Compound C (10 μmol/L). Thirty cells were evaluated per group, in the context of 3 independent experiments. The number of Rab9 signals was lower in E2‐treated cells with Compound C. Scale bar, 10 μm. *P<0.01 vs E2(+). All data are shown as the mean±SEM. AMPK indicates adenosine monophosphate‐activated protein kinase; E2, 17β‐estradiol; LAMP2, lysosome‐associated membrane protein 2; LKB1, liver kinase B1; SIRT1, sirtuin 1; and VSMCs, vascular smooth muscle cells.
