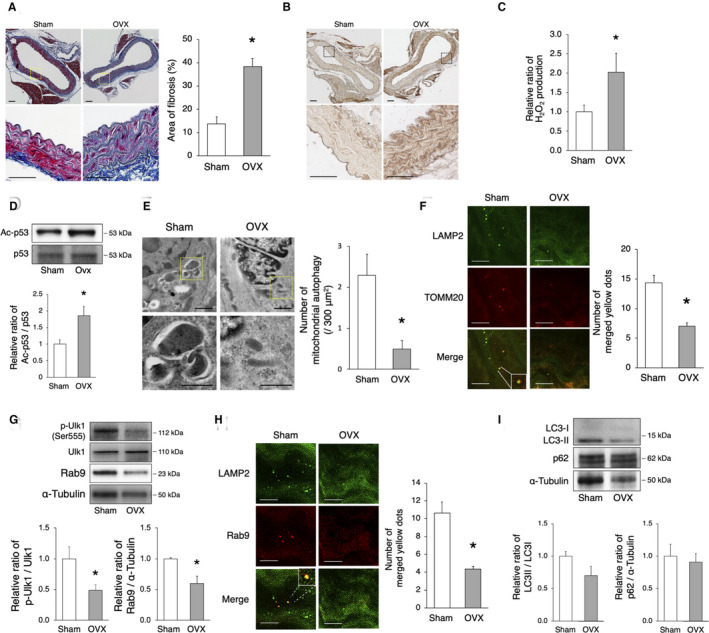
Figure 6. OVX promotes arterial senescence via the decrease of mitochondrial autophagy.

C57BL/6 mice were subjected to OVX or sham surgery. A, Assessment of aortic fibrosis in sham‐operated and OVX mice using the Masson’s trichrome staining 8 weeks after surgery. Enlarged images of the areas delineated by the dashed rectangles are shown below. The area of fibrosis was greater in OVX mice. Scale bar, 25 μm. *P<0.05 vs sham (n=3 per group). B, Representative images of 4‐HNE in sham‐operated and OVX mice. Immunoreactivity of 4‐HNE increased in the aorta of OVX mice compared with that of sham‐operated mice. C, The relative H2O2 production by isolated mitochondria from the aorta of sham‐operated and OVX mice 8 weeks after surgery was evaluated using the Amplex Red Assay. H2O2 production was higher in OVX mice. *P<0.05 vs sham (n=3 per group). D, Representative immunoblots and quantitative analysis of Ac‐p53 and p53 in sham‐operated and OVX mice. The expression of Ac‐p53 was higher in OVX mice than that in sham‐operated mice. *P<0.05 vs sham (n=4 per group). E, Electron microscopy images of the aorta from sham‐operated and OVX mice (upper panel, scale bar, 1 μm). Enlarged images of the areas delineated by the dashed rectangles are shown below (scale bar, 500 nm). More than 900 μm2 of the aorta of each mouse were screened in a random fashion; 3 samples per group were evaluated and the number of mitochondria engulfed by autophagosomes was counted. The number of mitochondrial autophagy was lower in OVX mice. *P<0.05 vs sham. F, Representative images of LAMP2 (green) and TOMM20 (red) immunohistochemistry of the aorta in sham‐operated and OVX mice. The merged yellow signals were lower in OVX mice. Scale bar, 5 μm. *P<0.05 vs sham (n=3 per group). G, Representative immunoblots and quantitative analysis of Ulk1 and Rab9 in sham‐operated and OVX mice. The expression of activated Ulk1 and Rab9 was higher in sham‐operated vs OVX mice. *P<0.05 vs sham (n=4 per group). H, Representative images of LAMP2 (green) and Rab9 (red) immunohistochemistry of the aorta in sham‐operated and OVX mice. The number of yellow signals was lower in OVX mice. Scale bar, 5 μm. *P<0.05 vs sham (n=3 per group). I, Representative immunoblots and quantitative analysis of LC3 and p62 in sham and OVX mice. The expression of both LC3 and p62 was not different between the 2 groups (n=4 per group). All data are shown as the mean±SEM. 4‐HNE indicates 4‐hydroxynonenal; LAMP2, lysosome‐associated membrane protein 2; LC3, light chain 3; OVX, ovariectomy; and TOMM20, translocase of outer mitochondrial membrane 20.
