
Figure 7. Estrogen rescues OVX‐induced arterial senescence via the induction of mitochondrial autophagy.
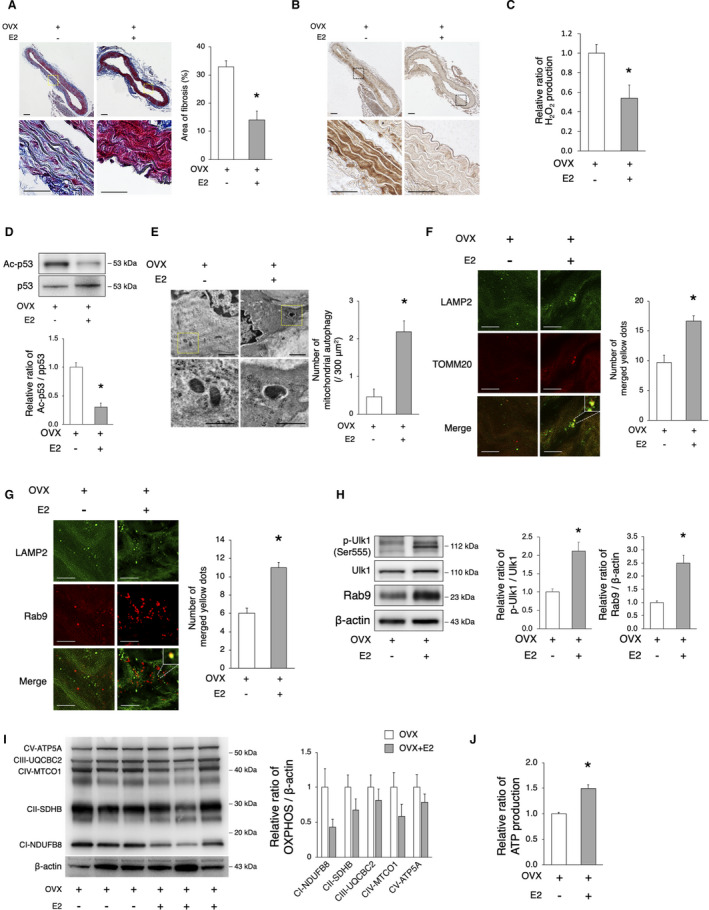
OVX mice were implanted with either E2 or control pellets for 8 weeks. A, Assessment of aortal fibrosis in OVX and OVX+E2 mice using the Masson’s trichrome staining 8 weeks after implantation. Enlarged images of the areas delineated by the dashed rectangles are shown below. The area of fibrosis was smaller in OVX+E2 mice. Scale bar, 25 μm. *P<0.05 vs OVX (n=3 per group). B, Representative images of 4‐HNE in OVX and OVX+E2 mice. Immunoreactivity of 4‐HNE increased in the aorta of OVX mice compared with that of OVX+E2 mice. C, The relative H2O2 production by isolated mitochondria from the aorta of OVX and OVX+E2 mice 8 weeks after implantation was evaluated using the Amplex Red assay. H2O2 production was lower in OVX+E2 mice. *P<0.05 vs OVX (n=3 per group). D, Representative immunoblots and quantitative analysis of Ac‐p53 and p53 in OVX and OVX+E2 mice. The expression of Ac‐p53 in OVX+E2 mice was lower than that in OVX mice. *P<0.05 vs sham (n=3 per group). E, Electron microscopy images of the aorta from OVX and OVX+E2 mice (upper panel, scale bar, 1 μm). Enlarged images of the areas delineated by the dashed rectangles are shown below (scale bar, 500 nm). More than 900 μm2 of the aorta of each mouse were screened in a random fashion; 3 samples per group were evaluated and the number of mitochondria engulfed by autophagosomes was counted. The number of mitochondrial autophagy was higher in OVX+E2 mice. *P<0.05 vs OVX. F, Representative images of LAMP2 (green) and TOMM20 (red) immunohistochemistry in OVX and OVX+E2 mice. The merged yellow signals were higher in OVX+E2 mice. Scale bar, 5 μm. *P<0.05 vs OVX (n=3 per group). G, Representative images of LAMP2 (green) and Rab9 (red) immunohistochemistry in OVX and OVX+E2 mice. The merged yellow signals were higher in OVX+E2 mice. Scale bar, 5 μm. *P<0.05 vs OVX (n=3 per group). H, Representative immunoblots and quantitative analysis of Ulk1 and Rab9 in OVX and OVX+E2 mice. The expression of activated Ulk1 and Rab9 in OVX+E2 mice was higher than that in OVX mice. *P<0.05 vs sham (n=3 per group). I, Representative immunoblots and quantitative analysis of total OXPHOS in OVX and OVX+E2 mice. The expression of total OXPHOS was not different between the 2 groups (n=3 per group). J, The relative ATP production of isolated mitochondria from the aorta of OVX and OVX+E2 mice 8 weeks after implantation was evaluated. ATP production was higher in OVX+E2 mice. *P<0.05 vs OVX (n=3 per group). All data are shown as the mean±SEM. 4‐HNE indicates 4‐hydroxynonenal; E2, 17β‐estradiol; LAMP2, lysosome‐associated membrane protein 2; OVX, ovariectomy; OXPHOS, oxidative phosphorylation; and TOMM20, translocase of outer mitochondrial membrane 20.