
Figure 6.
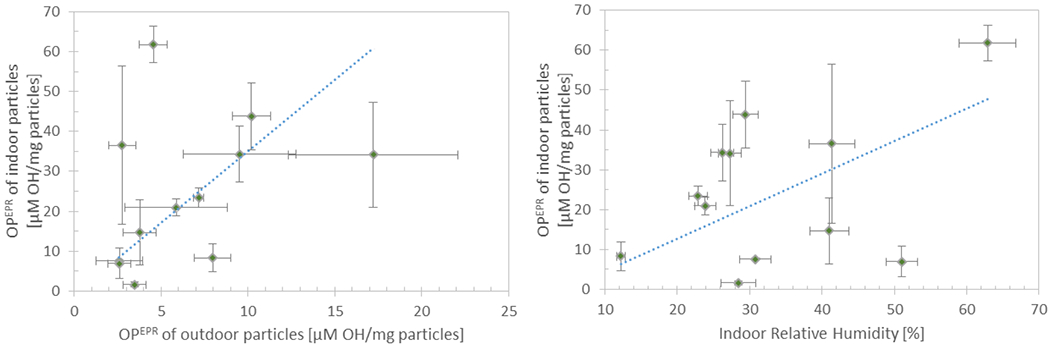
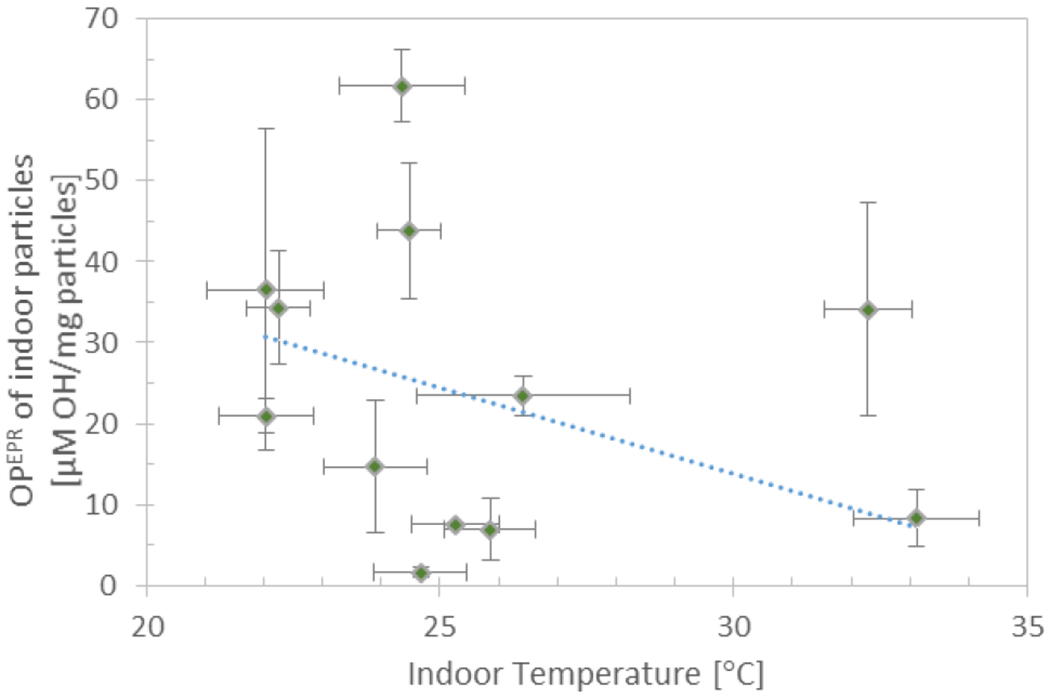
Mass normalized OPEPR of indoor particles shown as a function of mass normalized OPEPR of outdoor particles, indoor RH, and indoor temperature. The error bars on OPEPR depict the standard deviation of triplicate samples, and the error bars for other variables depict the standard deviation and measurement uncertainty of all measurements over the 4-day sampling period. The dotted line depicts the regression line calculated from the linear regression model developed with the three variables.