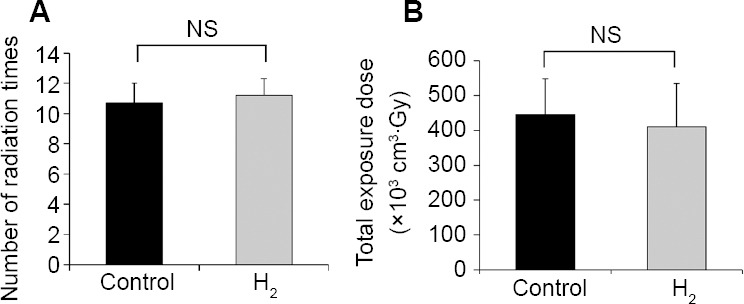
Figure 2.

Radiation conditions of patients in control and H2 groups
Note: (A) Number of radiation times for the control group and hydrogen (H2) group. (B) Total exposure doses of radiation for these groups. Data are given as the means ± SEM (n = 7 in control group, and n = 16 in H2 group), and were analyzed by Mann-Whitney U test. NS: Not significant.
