
Figure 4.
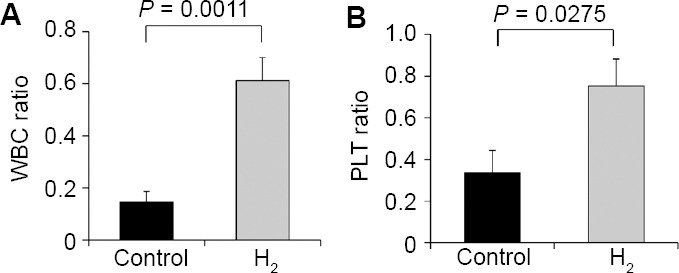
Effects of the hyperbaric hydrogen (H2) gas treatment on the white blood cell counts (WBC, A), and platelet counts (PLT, B) of patients in control and H2 groups
Note: WBC, and PLT were expressed as ratios of after to before the treatment. Data are given as the means ± SEM (n = 7 in control group, and n = 16 in H2 group), and were analyzed by Mann-Whitney U test.