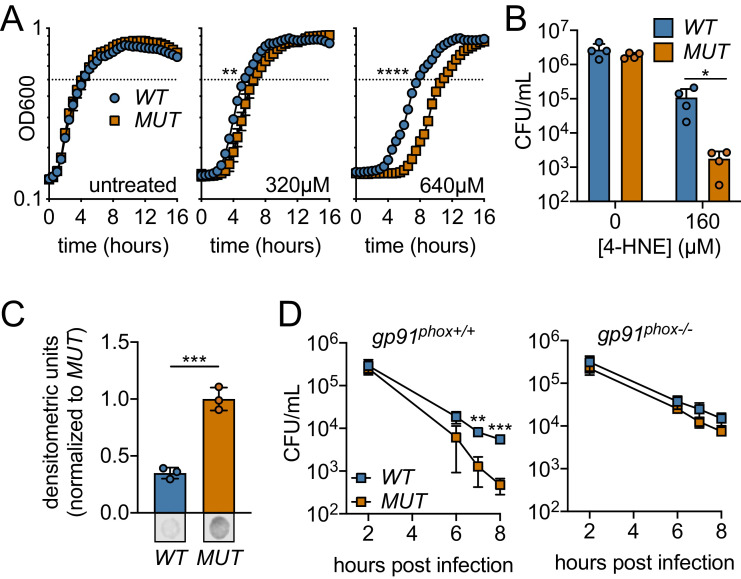
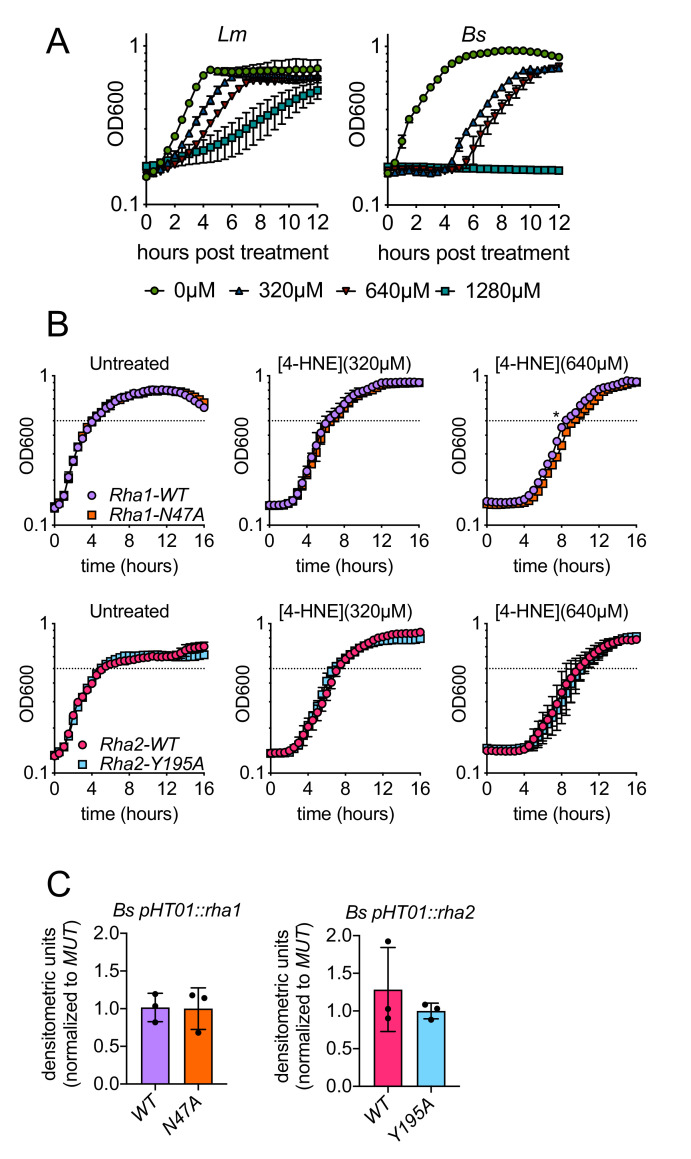
Figure 6. Ectopic expression or Rha1 and Rha2 confers 4-HNE resistance to sensitive bacteria.
(A) Growth of B. subtilis expressing either the WT or MUT (catalytically dead mutant) versions of rha1 and rha2 in TSB at 37°C in the presence of the indicated concentrations of 4-HNE added at time zero. Dotted line represents OD600 0.5. (B) Survival of B. subtilis WT and MUT in PBS at 37°C with 160 µM 4-HNE for 1 hr. (C) 4-HNE conjugates from B. subtilis WT and MUT soluble cell lysates (3 µg total protein) 3 hr after 4-HNE treatment as assessed by dot blot and quantified by densitometry on a Licor Odyssey Fc. Dot blots below are representative. (D) B. subtilis WT and MUT survival following phagocytosis by Interferon gamma-activated primary WT or phagosomal oxidase-deficient bone-marrow-derived macrophages (WT or gp91phox-/- pBMMs). All experiments were performed in biological triplicate. Statistics in (A) are unpaired t-tests comparing the hours to OD600 0.5 between WT and MUT B. subtilis pHT01::rha1/2. Statistics in (B), (C) and (D) are unpaired t-tests comparing WT and MUT B. subtilis pHT01::rha1/2. Error bars are mean ± SD. *p<0.05; **p<0.01; ***p<0.001; ****p<0.0001.


