
Figure 7.
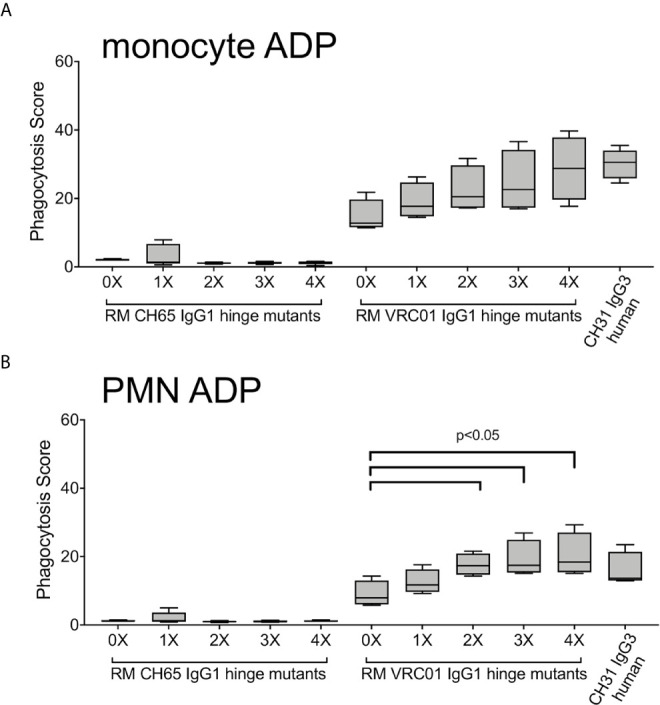
ADP activity of immune complexes formed with fluorescent HIV-1 BaL virions and RM IgG1 hinge-variant mAbs in assays performed with (A) monocytes and (B) PMN isolated from 2 RM, evaluated in two independent experiments. Box plots represent the interquartile ranges, horizontal lines indicate the medians, and error bars extend to the 10th and 90th percentiles.