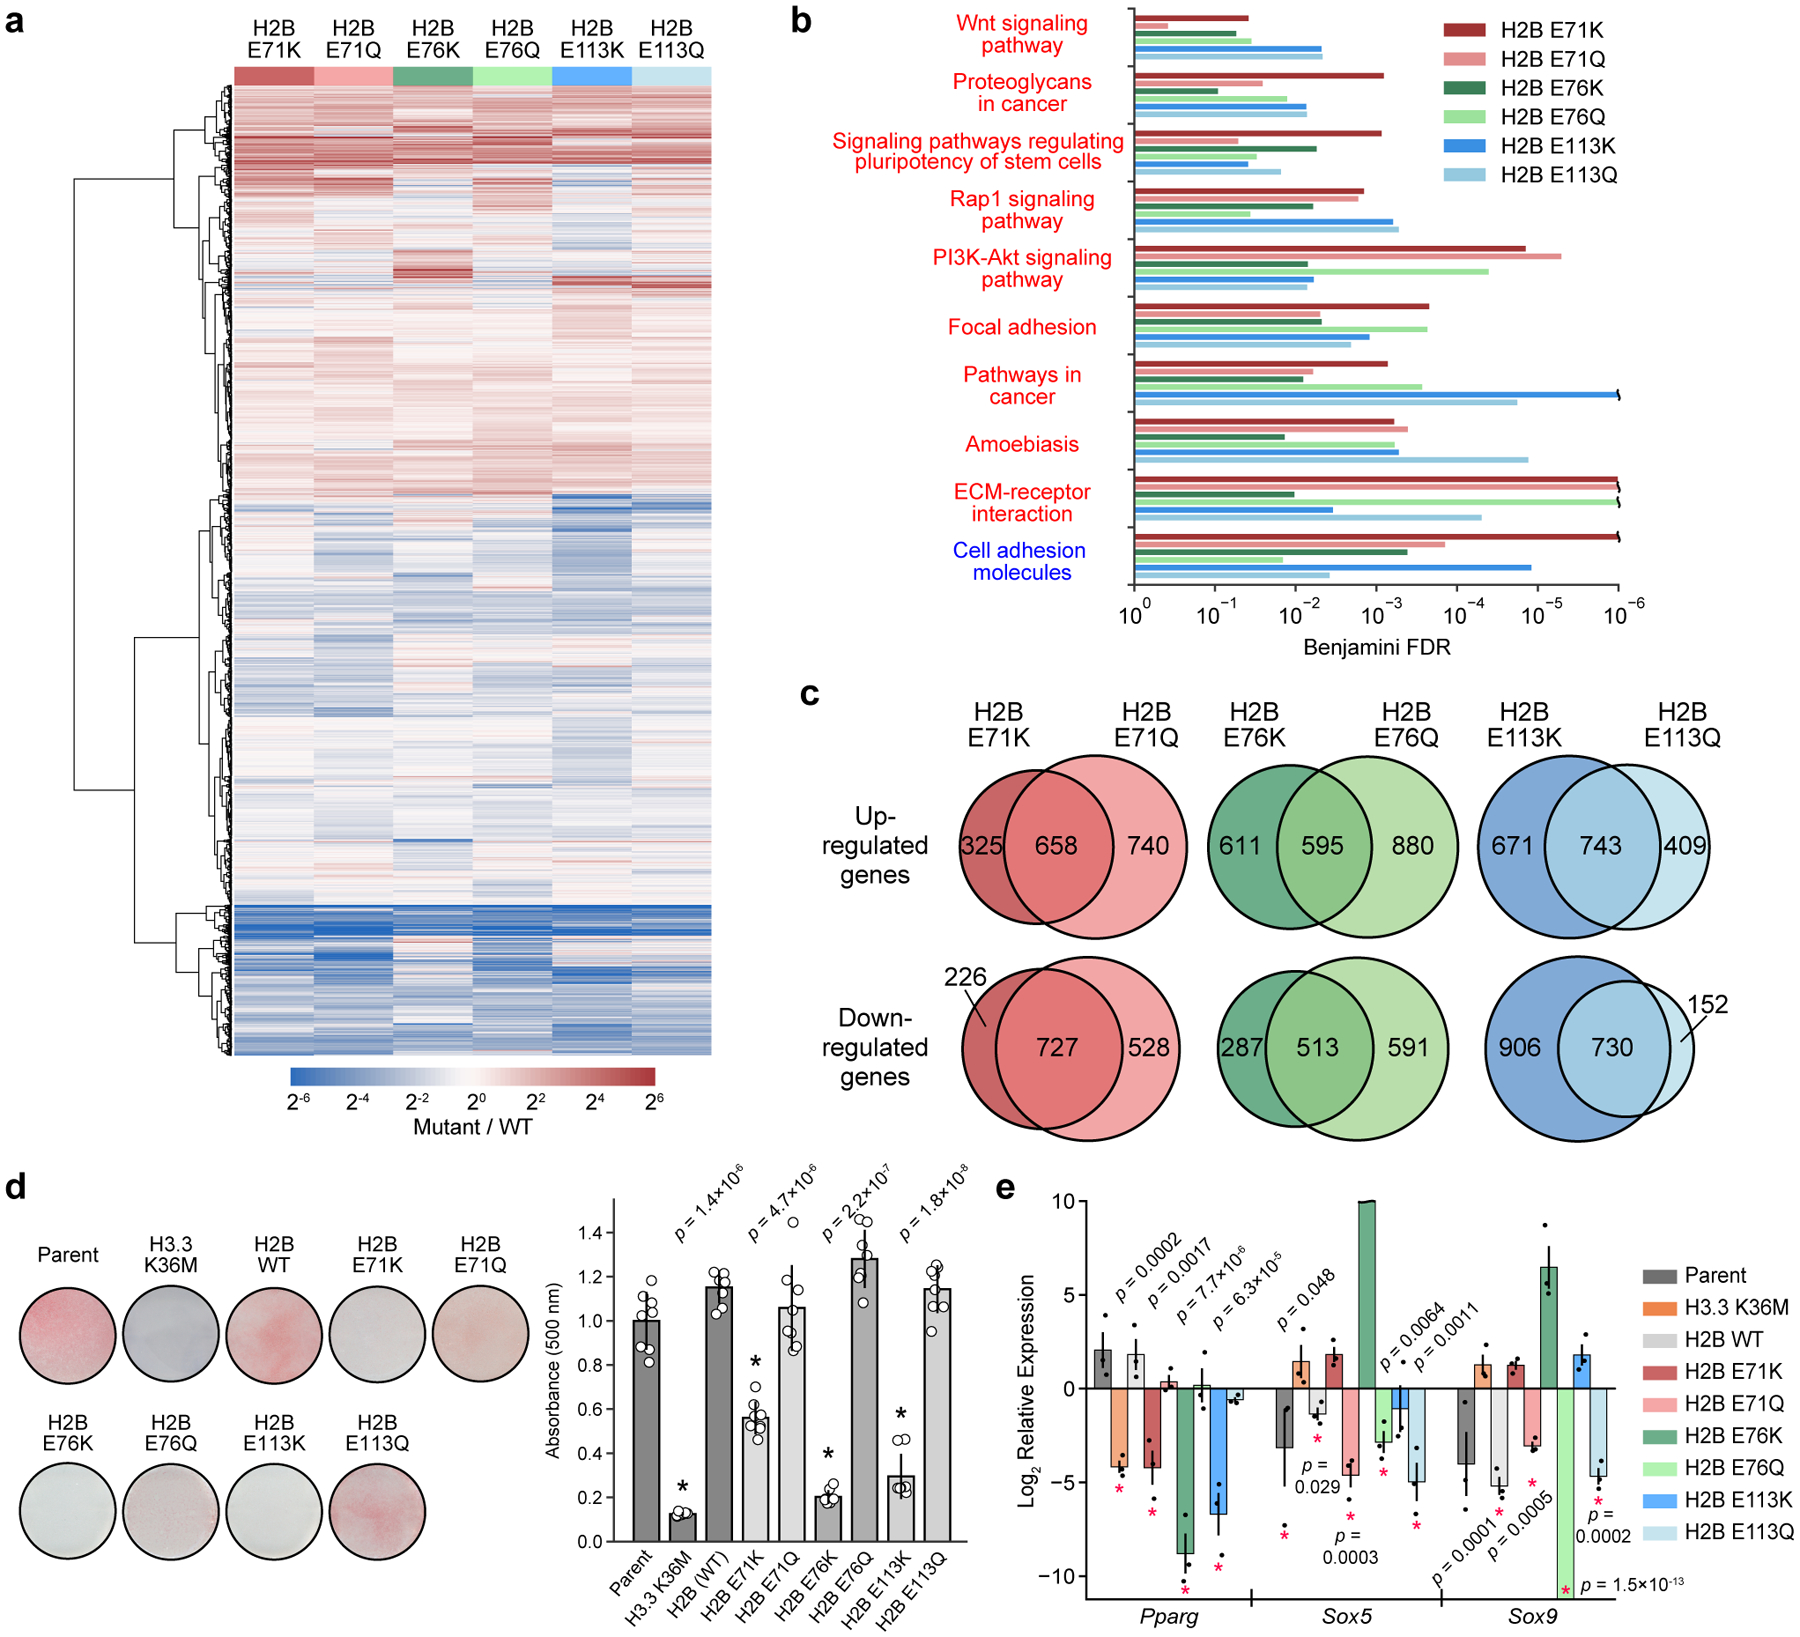
Figure 5 |. Globular domain mutations alter gene expression and impair cell differentiation.

a, Heatmap depicting average differential gene expression in C3H10T1/2 cells stably expressing either wild-type or mutant H2B (n = 3 separately generated cell lines each at distinct passage numbers). b, Gene ontology (GO) analysis showing significantly upregulated (red text) and downregulated (blue text) KEGG pathways for cells expressing mutant histones (n = 3 separately generated cell lines). Pathways significantly affected (Benjamini FDR < 0.05) in at least 4 of the 6 mutants are shown. Expanded GO analyses for individual mutants are shown in Extended Data Fig. 9. c, Venn diagrams comparing significantly upregulated and downregulated genes (FDR < 0.05) for cells expressing Lys and Gln mutations at H2BE71, E76, and E113. d, Mutant and wild-type H2B cell lines were induced to undergo adipocyte differentiation for 7 days. Representative images are shown after Oil Red O staining. The barplot shows the mean ± SD of quantified Oil Red O staining of cell extracts (n = 8 biologically independent samples). An asterisk marks mutant cell lines that caused a significant reduction in staining compared to both the parent line and to cells expressing wild-type H2B (p < 0.05, two-sided unequal variances t-test). e, Expression of master transcriptional regulators at day 4 of adipocyte differentiation as assessed by RT-qPCR. Mutant H2B and H3 values are displayed relative to the wild-type H2B and parent expression levels, respectively, at day 0. Asterisks mark values with significant difference from reference genes at day 0 (p < 0.05, two-sided unequal variances t-test). Data are presented as the mean ± SEM (n = 3 biologically independent samples).
