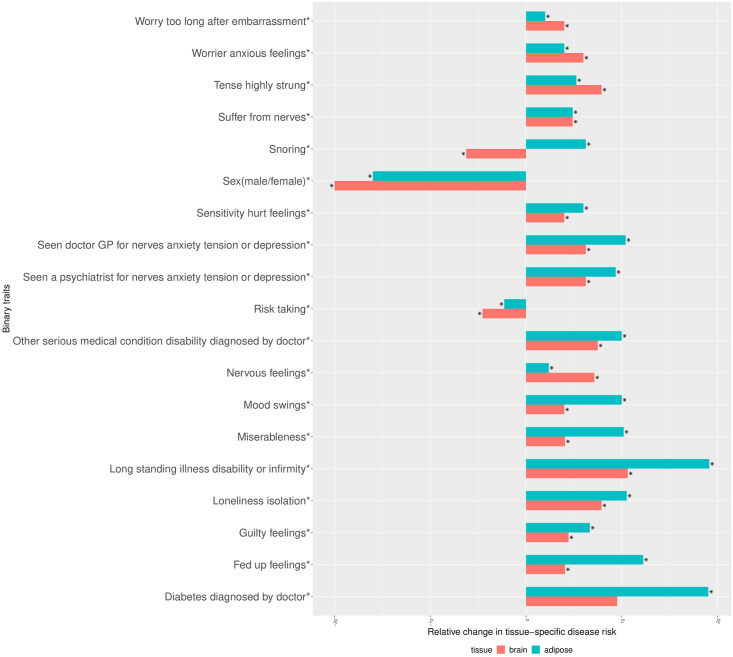
Fig 6. Percentage of tissue-specific relative change in the risk of case-control traits between the individuals assigned to a tissue-specific subtype of BMI and the population.
The tissue-specific relative change of a disease risk is measured by: . Tissue-specific prevalence of the disorder was computed only in the individuals classified as the corresponding tissue-specific subtype of BMI. The asterisk mark attached to the traits indicate which trait remains differentially distributed between at least one of the adipose and brain tissue-specific groups of individuals and the remaining population after BMI adjustment. For each trait the asterisk mark attached to the bars indicate which tissue-specific group of individuals remains significantly heterogeneous for the trait after BMI adjustment.

