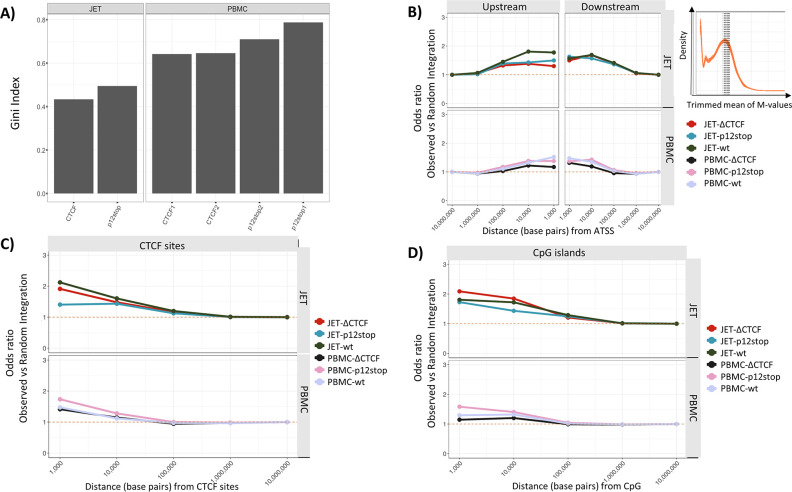
Fig 4. Effect of CTCF-BS Mutation on HTLV-1 Integration Sites.
A) Clonality of HTLV-1 and HTLV-1ΔCTCF integration sites in JET cells and PBMCs, as measured by the Gini index. Inconsistent results were obtained with HTLV-1 WT infected cells. B-D). Frequency distribution of observed WT HTLV-1, HTLV-1p12stop, and HTLV-1ΔCTCF integration sites compared to random expectation within indicated window sizes (base pairs) in JET cells and PBMCs. B) Frequency of integration positions relative to upstream or downstream active transcription start sites (ATSS). The inset shows the transcriptional frequency of active genes in normal CD4+ T lymphocytes, with the shaded gene showing that for Fox P3. C) Frequency of HTLV integration sites relative to cellular CTCF sites. D) Frequency of HTLV integration sites relative to CpG islands.

