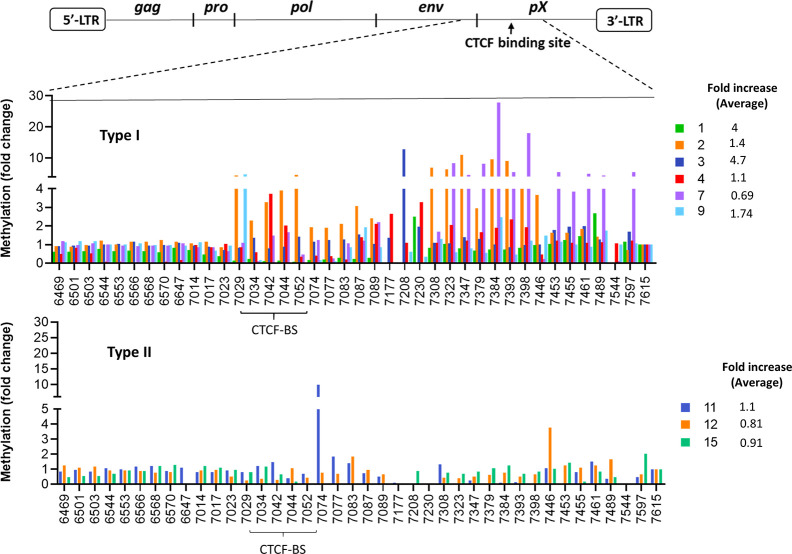
Fig 6. CTCF knock down by shRNA in clonal JET cell lines results in expansion of DNA methylation in the pX region of the provirus.
DNA methylation of the HTLV-1 provirus is presented as fold change, CTCF vs control shRNA (Y-axis) at the indicated locations of the viral DNA (X-axis). Average fold increase is calculated from nt 7029 to 9615. The schematic diagram of the HTLV-1 provirus indicates the regions examined by bisulfite treatment and DNA sequencing as described in the Materials and Methods. Upper panel: Type I clonal cell lines. Lower panel: Type II clonal cell lines.

